Using the Spectroscopy Database
Contents
- Quick guides
- Using the search page
- Using the results page
- Using the spectrum plot
- Material index page
1. Quick guides
The following guides provide a quick walk-through of how to search for luminescence and soft x-ray emission spectroscopy (SXES) emission lines and spectra:
- Searching for luminescence emission lines
- Searching for luminescence spectra
- Searching for SXES spectra
Searching for luminescence emission lines
- Visit the luminescence search page at luminescence.csiro.au
- Select the search for lines radio button
- Select the material of interest, by either:
- Using the Select material dropdown list (selecting by material name),
- Using the Select formula dropdown list (selecting by chemical formula), or;
- Choose the material name from the browse for minerals or materials list at the bottom of the search page.
- If you wish to limit the search results to emission lines from only one specific emission center, select the emitter from the Select emitter dropdown list. (Note this is optional; the default behaviour is to return all lines that match the selected material.)
- Press the Submit button.
- The results page will list the luminescence emission lines in the database matching the specified material name or formula, including the position (i.e. wavelength or energy of the line), and the reference (including the DOI link to the original publication, if available.) If the database contains the luminescence spectra from which the lines were measured, the spectra and lines will also be plotted in the spectrum plot on the results page, below the table of results.
Searching for luminescence spectra
- Visit the luminescence search page at luminescence.csiro.au
- Select the search for spectra radio button
- Select the material of interest, by either:
- Using the Select material dropdown list (selecting by material name),
- Using the Select formula dropdown list (selecting by chemical formula), or;
- Choose the material name from the browse for minerals or materials list at the bottom of the search page.
- Press the Submit button.
- The results page will show a spectrum plot containing spectra from the selected material name or formula, along with a table of the spectra showing the source reference (including the DOI link to the original publication, if available.), as well as checkbox controls for showing or hiding specific spectra (multiple spectra can be plotted simultaneously).
Searching for SXES spectra
- Visit the SXES search page at spectroscopy.csiro.au/sxes
- Select the material of interest, by either:
- Using the Select material dropdown list (selecting by material name),
- Using the Select formula dropdown list (selecting by chemical formula), or;
- Choose the material name from the browse for minerals or materials list at the bottom of the search page.
- Press the Submit button.
- The results page will show a spectrum plot containing spectra from the selected material name or formula, along with a table of the spectra showing the source reference (including the DOI link to the original publication, if available), as well as checkbox controls for showing or hiding specific spectra (multiple spectra can be plotted simultaneously).
2. Using the search page
The search page of the CSIRO Spectroscopy Database allows researchers to search for published emission lines and spectra measured from a range of materials using luminescence spectroscopy or soft x-ray emission spectroscopy (SXES).
Search page controls
The search page consists of:
- A Select database dropdown list, to specify whether you wish to search for luminescence lines and spectra, or for SXES spectra
- Material and Formula dropdown lists, for searching by material name, or chemical formula
- An alphabetical list of materials, for selecting materials by name
- An Emitter dropdown list, for (optionally) refining the luminescence line search to only include results for a specific emission center (default is 'Show all')
- An search mode toggle for searching for emission line positions, or for whole spectra
- Submit and Clear buttons
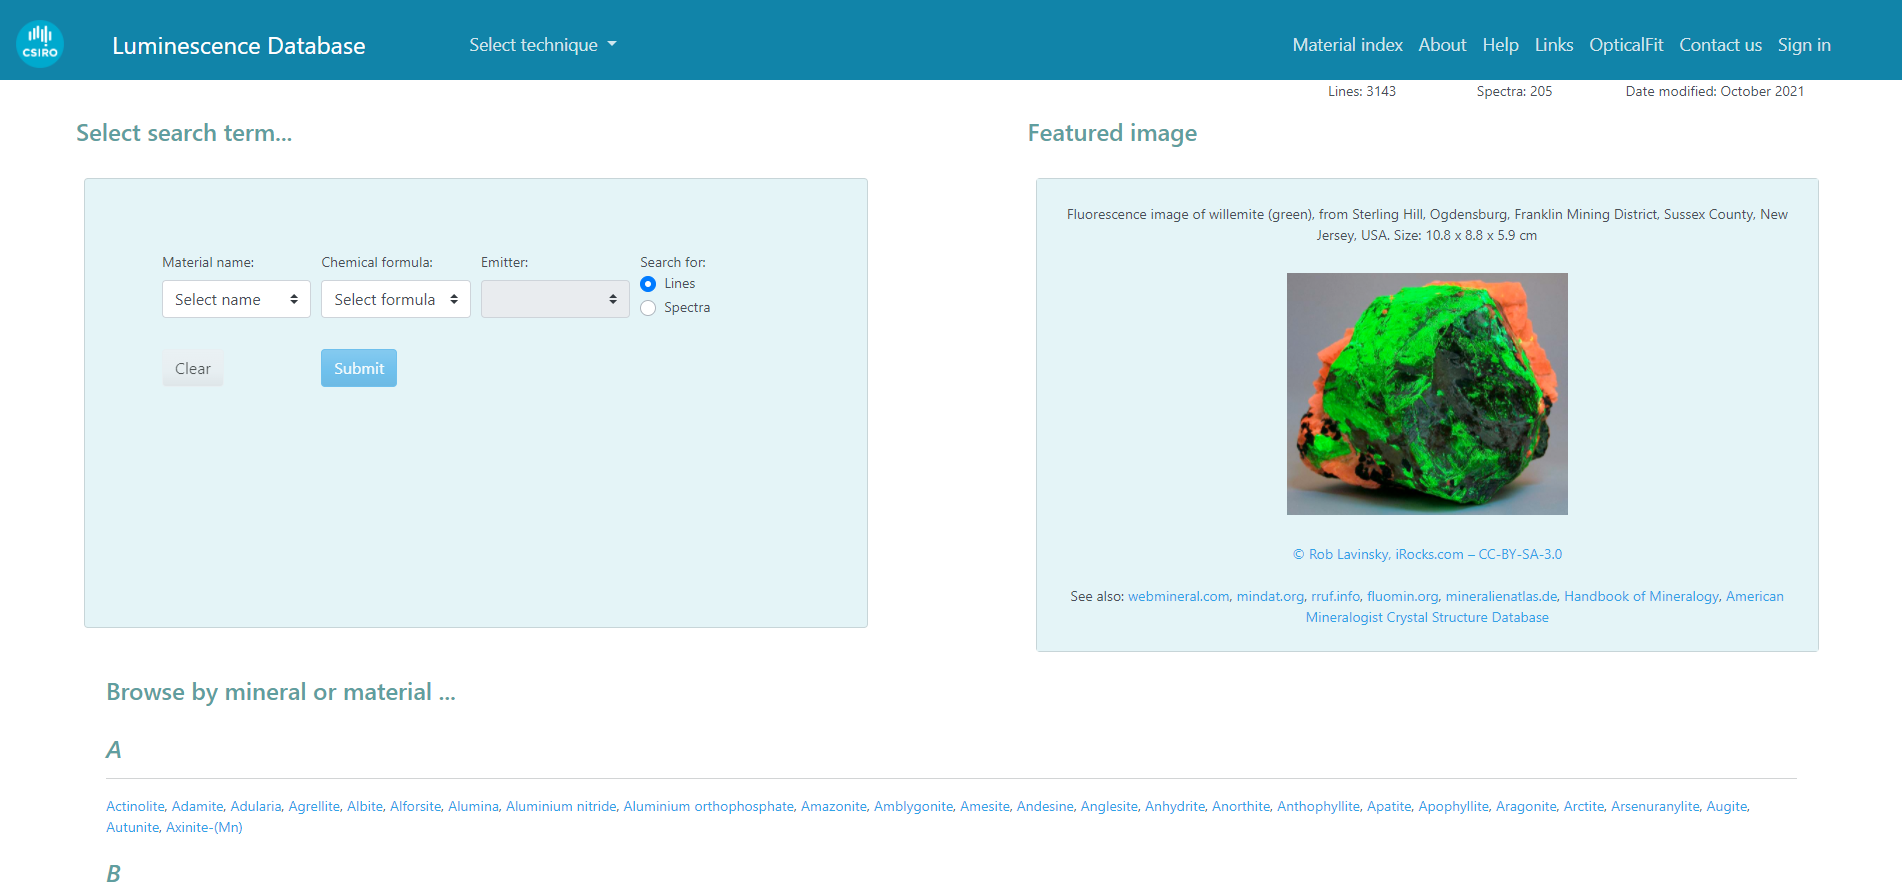
The luminescence database search page.
Selecting spectroscopy techniques
You may switch between the luminescence database and soft x-ray emission spectroscopy (SXES) database using the Select database dropdown list at the top of the page, to the right of the title heading.
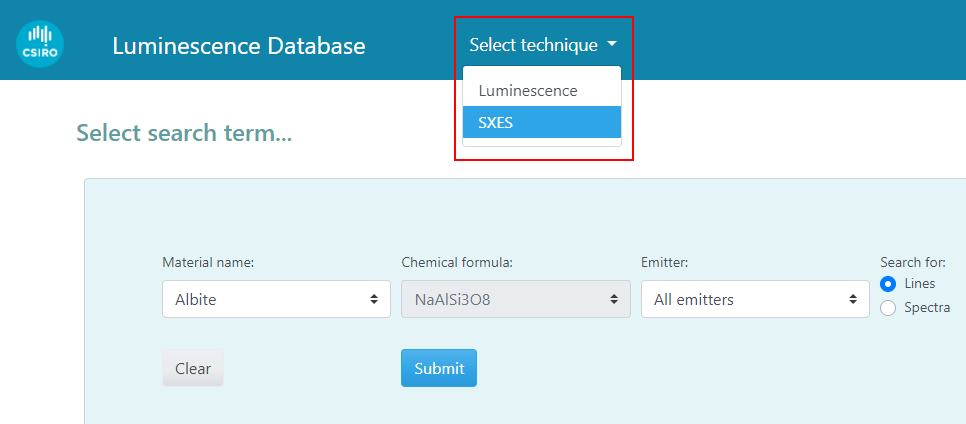
The title heading of the search page indicates the spectroscopy technique being searched, and will change between "Luminescence database" and "SXES database" (on both the search and results pages) depending on the selection in the technique dropdown list.
Note also that not all materials measured by luminescence have been measured by SXES (and vice versa), thus the available materials in the Select material/formula dropdown lists will change to reflect the materials available for the selected technique.
Luminescence database
If the Select database dropdown list is set to "Luminescence", the search page will query the luminescence database for emission lines and emission spectra measured by cathodoluminescence (CL), photoluminescece (PL, including x-ray, UV, laser, etc.), ionoluminescence (IL), thermoluminescence (TL), and assorted other luminescence emission techniques.
The luminescence database is compiled primarily from searches of published literature, and is augmented in some cases by spectra provided by the publication's authors, as well as spectra collected at the CSIRO Mineral Resources Microbeam Laboratory, in Clayton, Australia (see credits on the About page).The direct link to the CSIRO Luminescence Database search page is luminescence.csiro.au.
Soft x-ray emission spectroscopy (SXES) database
If the Select database dropdown list is set to "SXES", the search page will query the SXES database for emission spectra measured by soft x-ray emission spectroscopy (SXES) on an electron probe micro-analyser (EPMA) and/or scanning electron microscope (SEM).
The SXES database contains spectra collected at the CSIRO Mineral Resources Microbeam Laboratory, in Clayton, Australia (see credits on the About page).The direct link to the CSIRO SXES Database search page is spectroscopy.csiro.au/sxes.
Searching for emission lines or spectra?
The Search for radio buttons (shown below) allow you to:
- Search for emission lines. This search mode will return a table of results containing the wavelength/energy of known emission lines for the selected material. Emission line results may optionally be filtered using the Emitter dropdown list. If the emission line entry in the database has an associated spectrum, the spectrum will also be returned in the results, and may be viewed in the spectrum plot on the results page.
- Search for spectra. This search mode will return a table containing only the emission spectra for the selected material, which may then be viewed in the spectrum plot on the results page. Any emission lines associated with the selected spectra may be displayed (or hidden) in the spectrum plot using the Show lines and Hide lines button.

The 'Search for emission lines or spectra' radio buttons.
Note: Searching for emission lines is only available for the luminescence database. The SXES database always searches for spectra.
Selecting materials
To search for lines or spectra for a particular material, you may either select the material by name, or by chemical formula using the Material name and Chemical formula dropdown lists (see below). Alternatively, you may select the material by name using the Browse for minerals or materials alphabetically-sorted list of materials provided beneath the search controls.
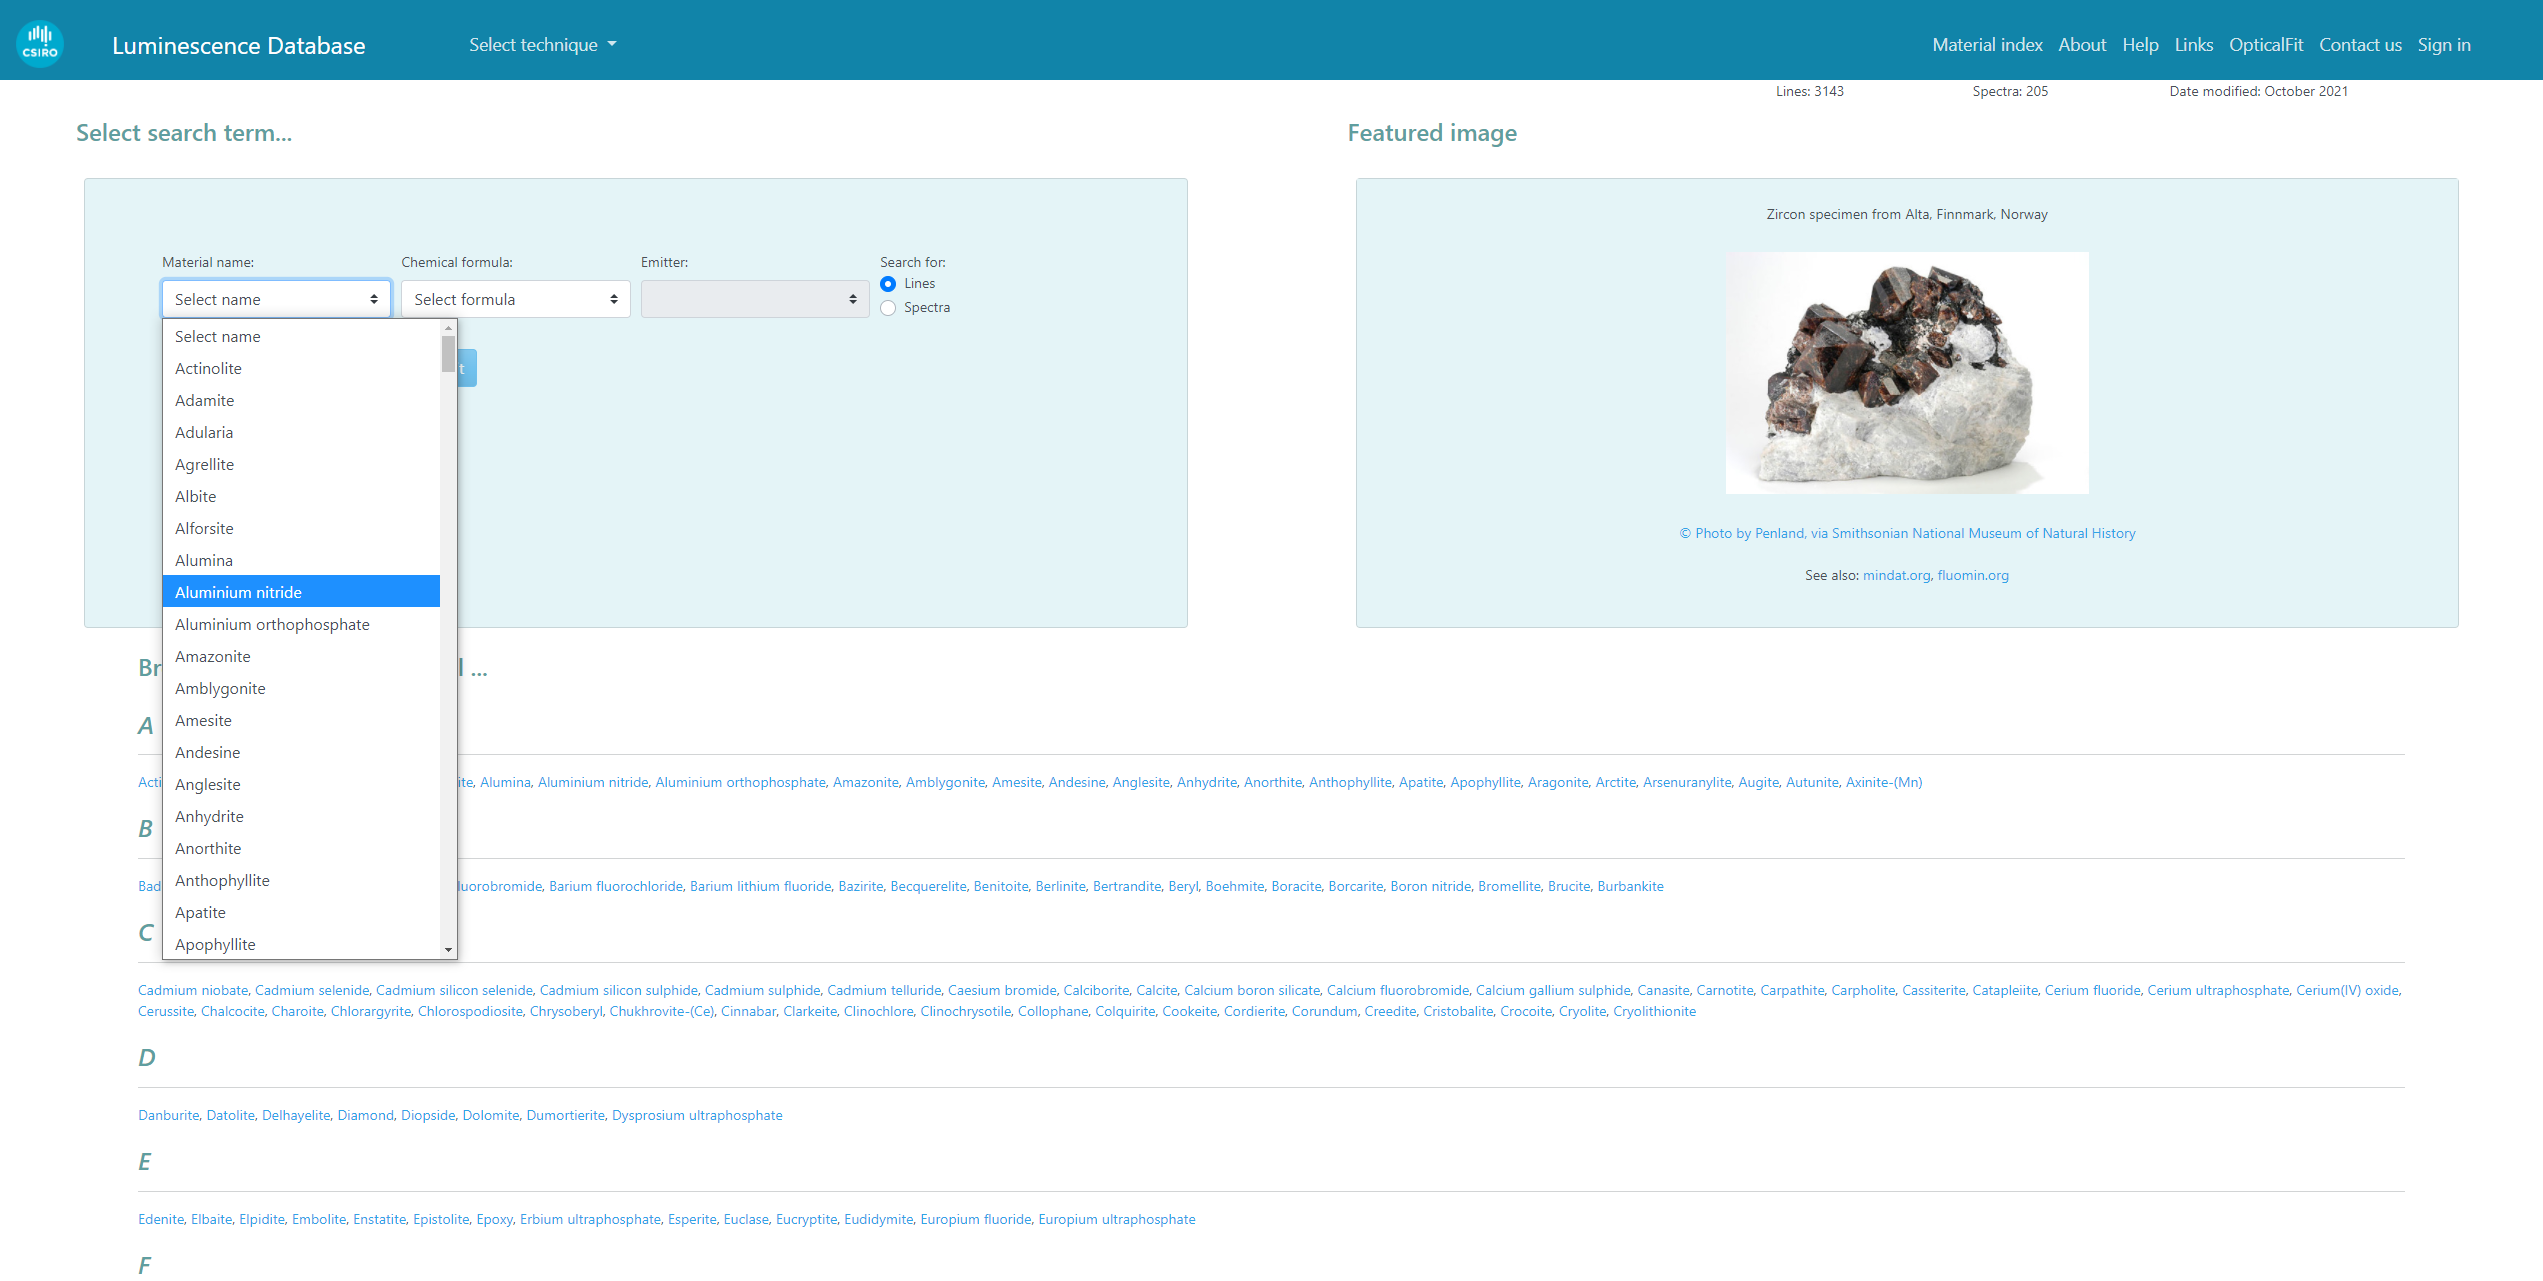
|
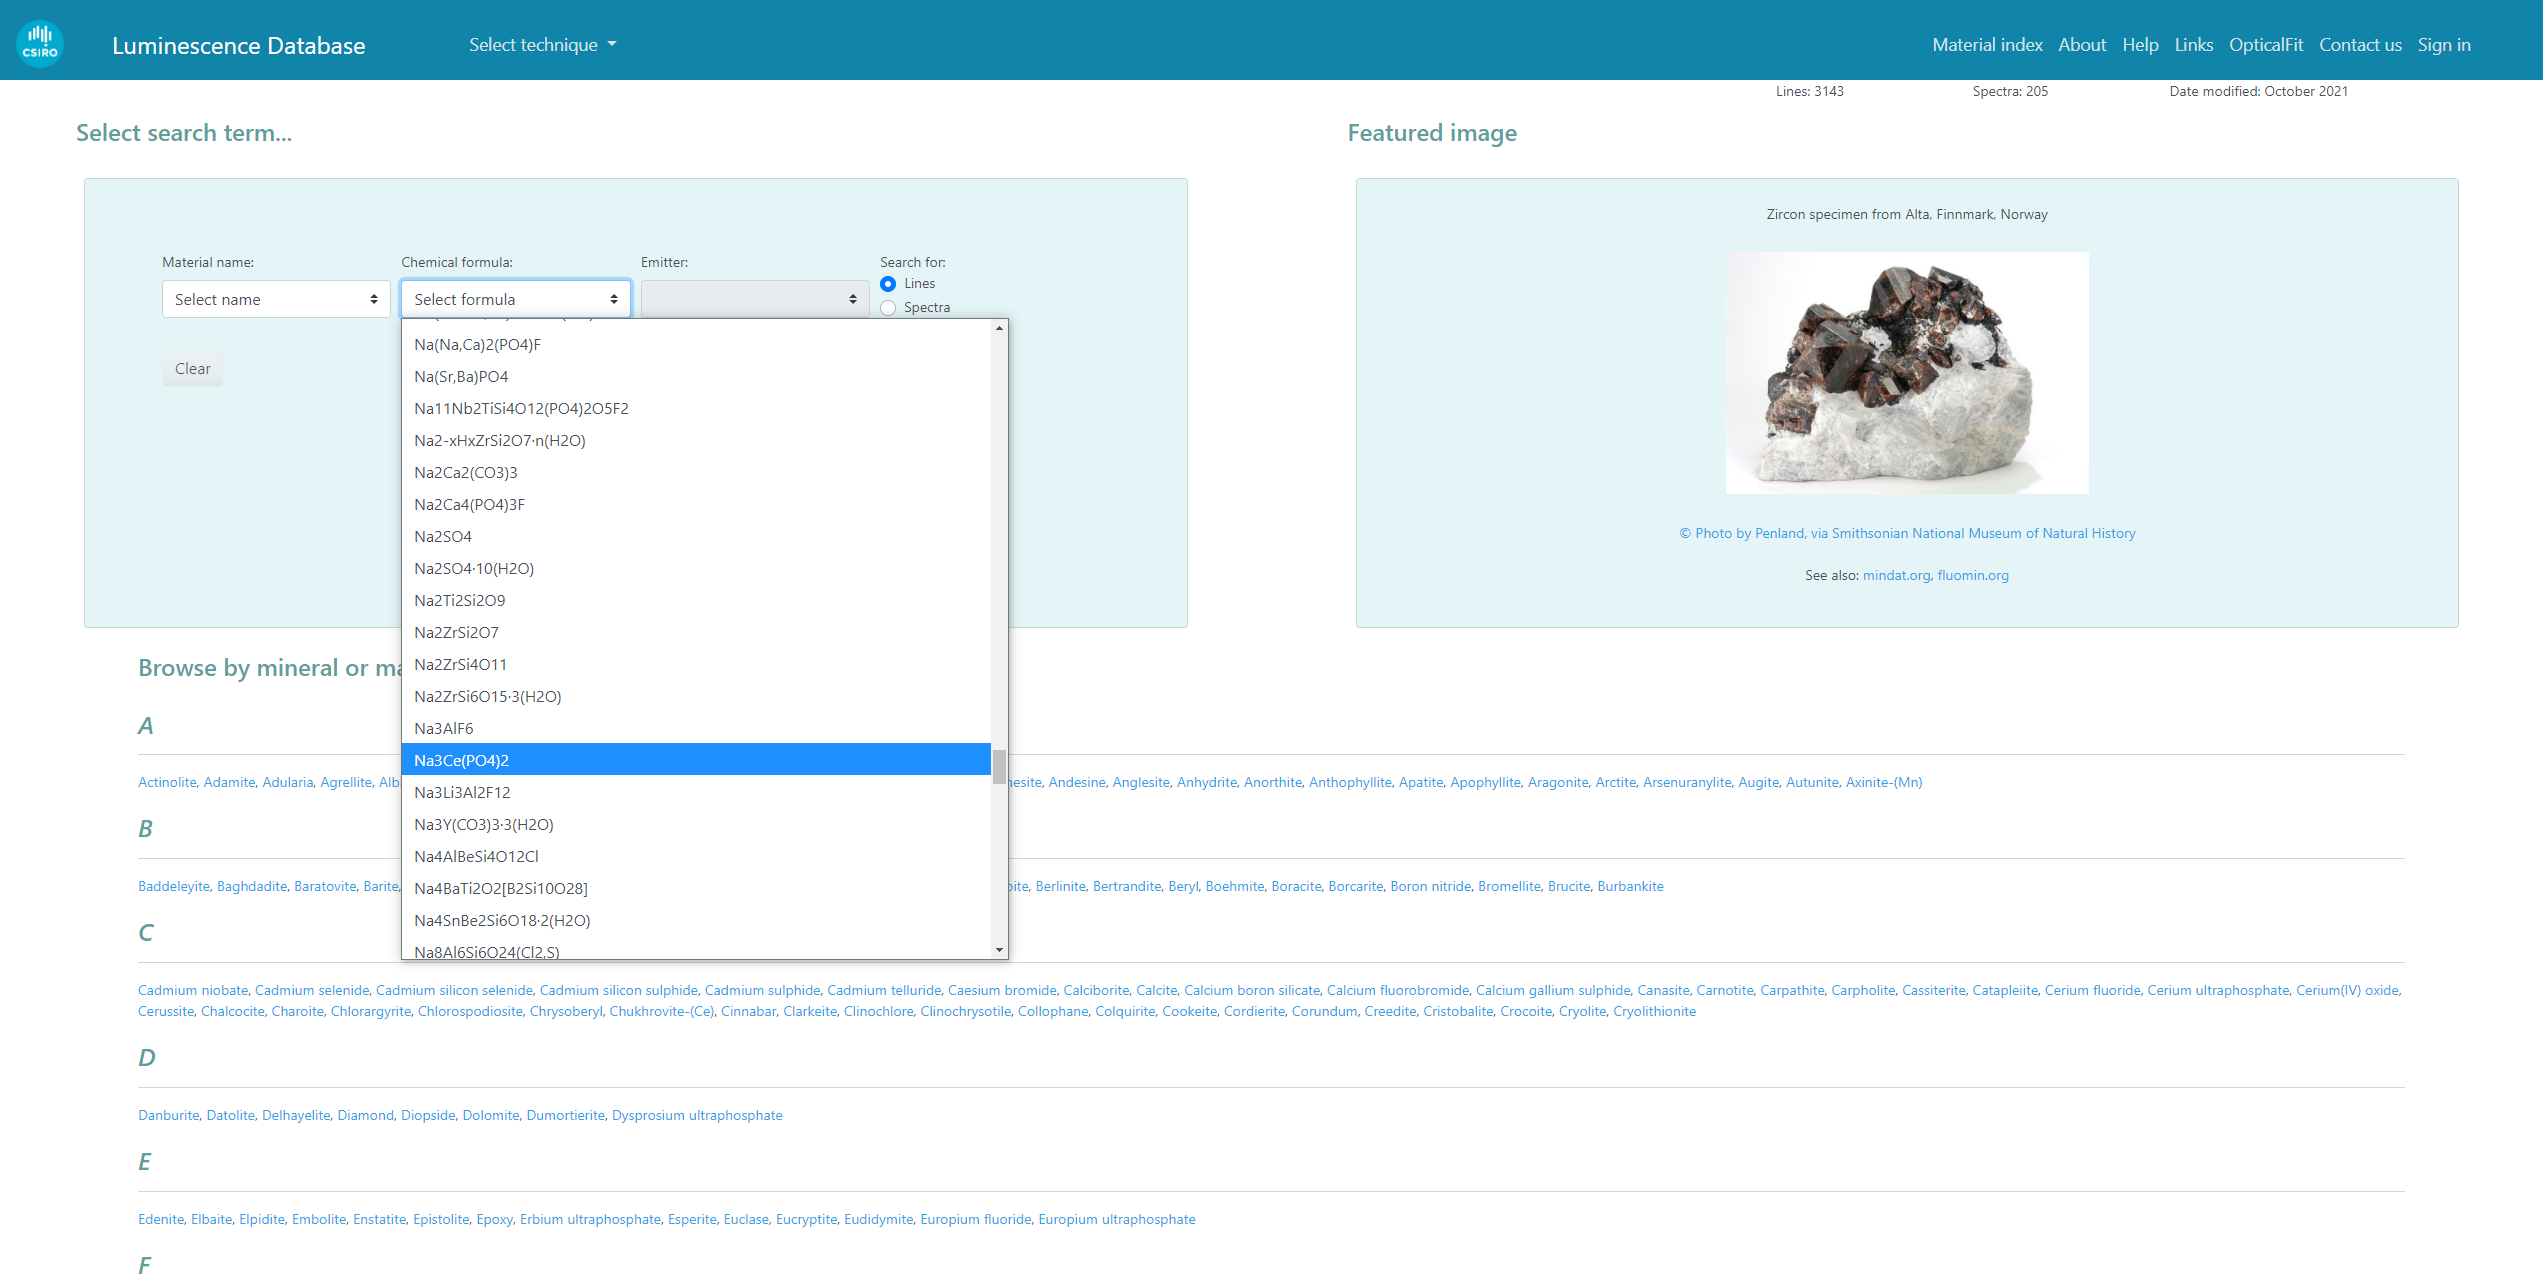
|
| Searching by material name. | Searching by chemical formula. |
Browse for minerals or materials
On the search page, below the search controls, is an alphabetical list of all materials in the database that match the currently selected spectroscopy technique, under the Browse by mineral or material heading. Clicking on any of the material links in this list will change the selection in the Select material dropdown list to match your selection, and automatically scroll back to the top of the search page so that you can (optionally) select the emitter, before pressing the Submit button.
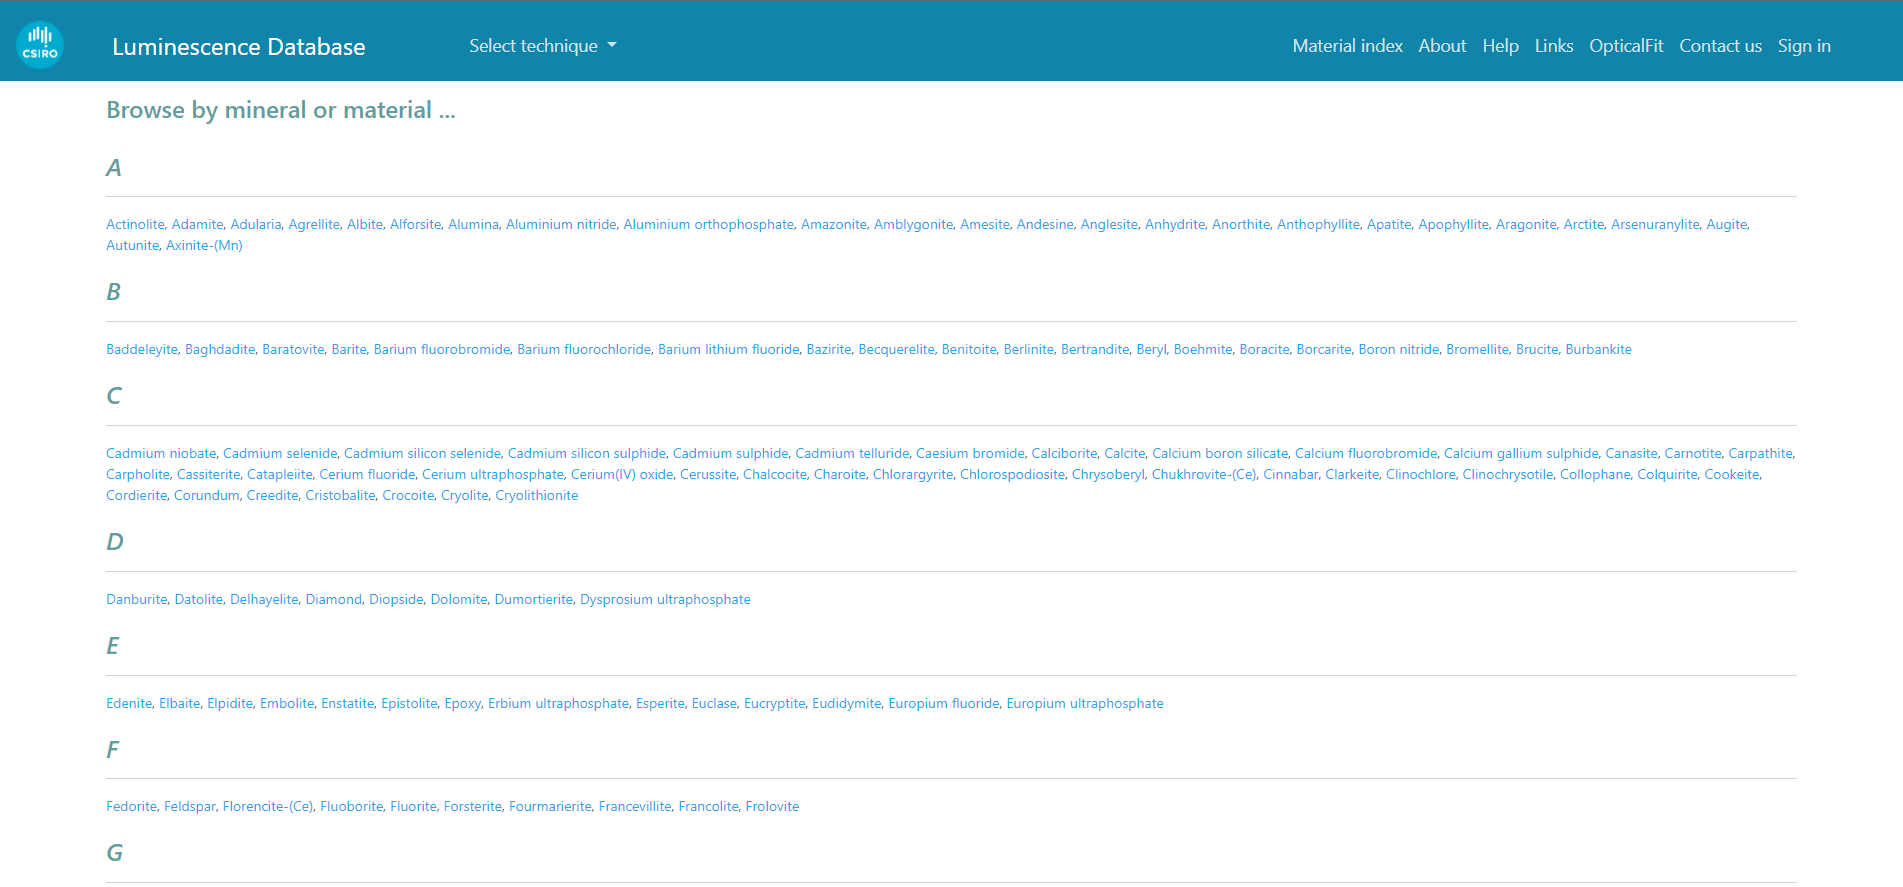
The alphabetical list of materials on the search page. Clicking on any of these material names automatically updates the Select material dropdown list.
Selecting emitters
Once you have selected the material, you may then select the desired luminescence emitter from the Emitter dropdown list (see below) and click Submit to show the luminescence lines/bands in the database for the selected material and emitter. If you select the 'Show all' option in the Emitter dropdown list, all luminescence lines for the selected material will be displayed.
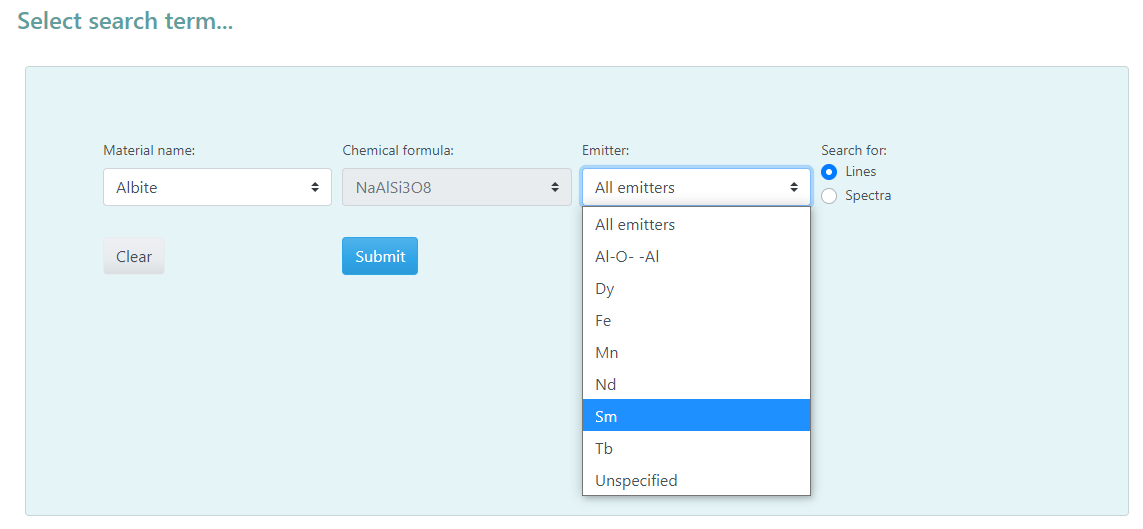
Using the 'Select emitter' dropdown list to limit search results to specific emission centers.
Note: Pre-filtering results by emitter is only available when searching for emission lines in the luminescence database.
Submit and Clear buttons
To see the emission lines or spectra from your selected material, press the Submit button.
To clear the currently selected material (and emitter) from the search page, press the Clear button.
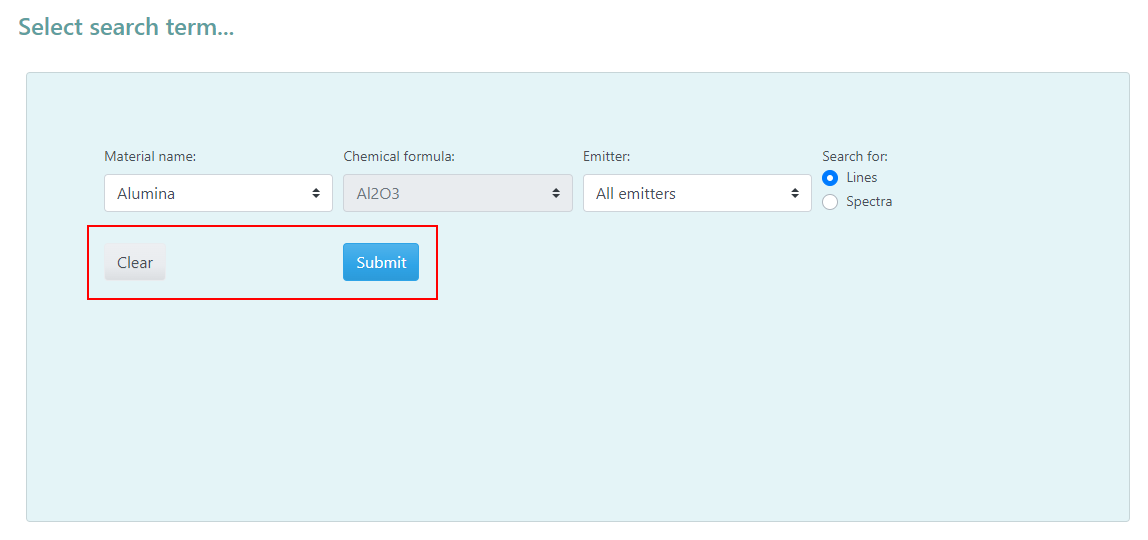
The 'Clear' and 'Submit' buttons on the search page.
3. Using the results page
After you click on the Submit on the search page, you will be passed through to the results page, which should resemble something like that shown below.
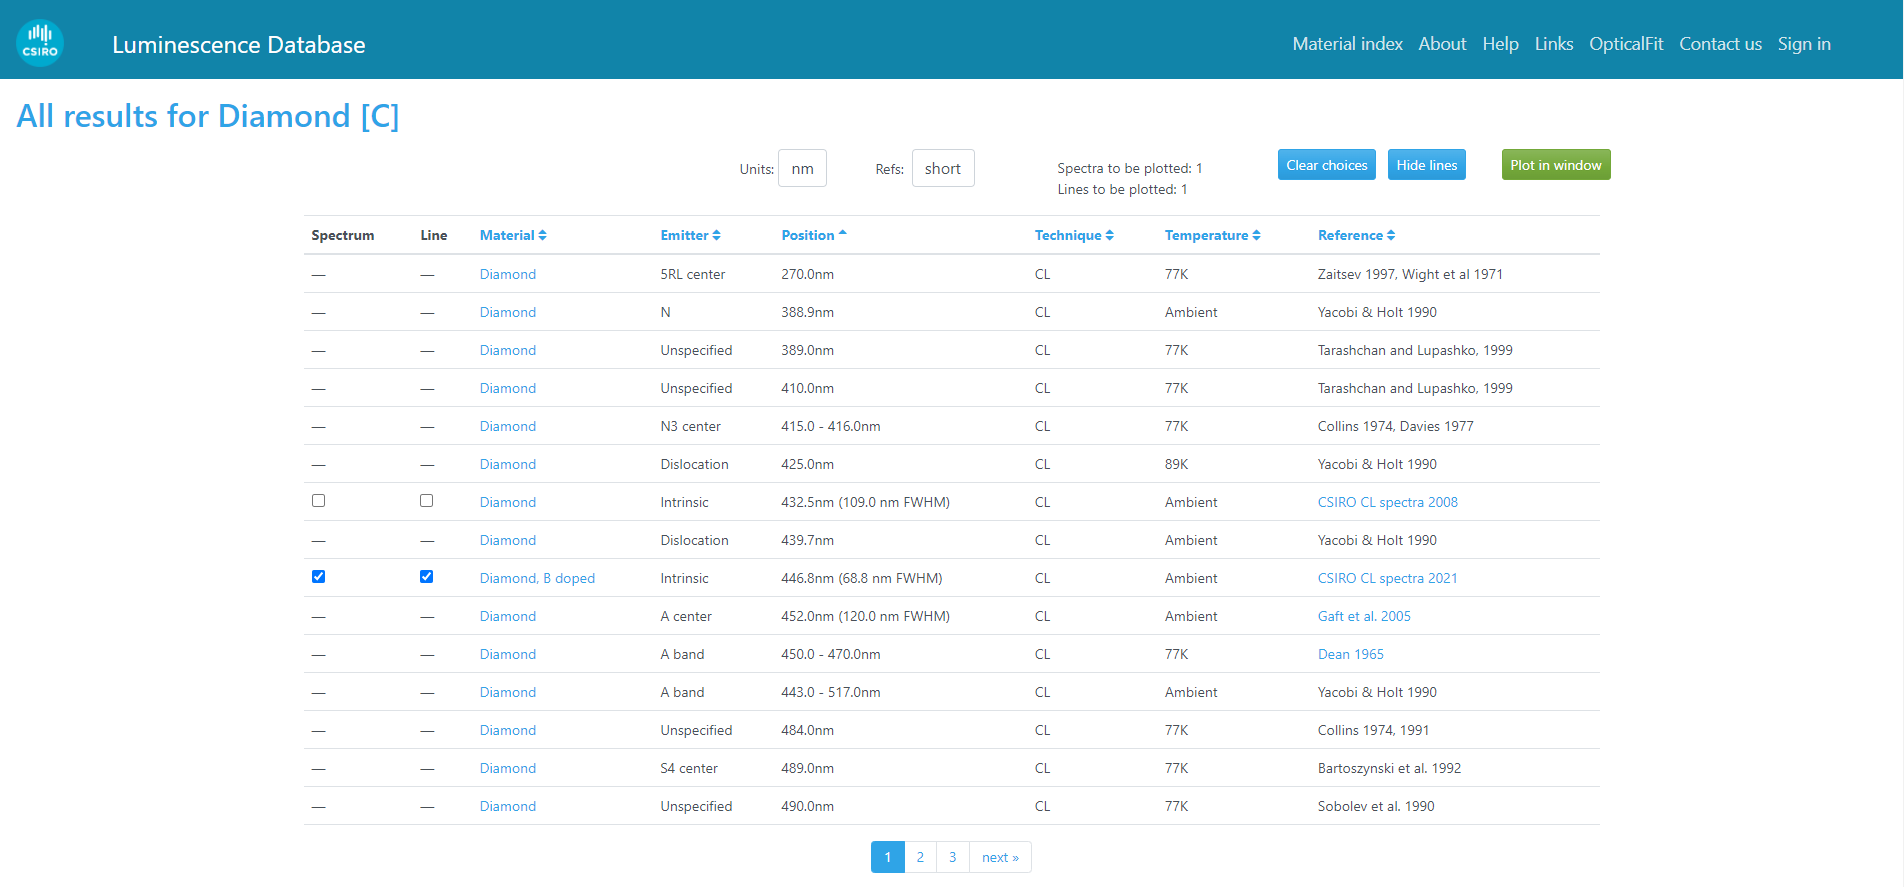
The results table, showing the spectrum, line, material, emitter, position, technique, temperature, and reference columns.
Spectrum and Line checkbox columns
If the selected search terms return results containing spectra, the Spectrum column will be shown in the results table, containing checkboxes that allow the user to show or hide individual spectra in the spectrum plot on the results page, underneath the results table.
If searching for emission lines, any line with a corresponding spectrum will also have a checkbox in the Line column, which allows the user to toggle the display of the peak overlay in the spectrum plot, which graphically displays the position, height and width of the emission line.
The 'Spectrum' and 'Line' checkbox columns allow you to select items to be displayed in the spectrum plot.
User selections of the checkboxes in the Spectrum and Lines columns in the results table are remembered by the site, and will be included in subsequent search results during each visit, which allows users to compare the spectra of different materials.
All selected spectra and lines may be cleared using the Clear choices button.
Material column
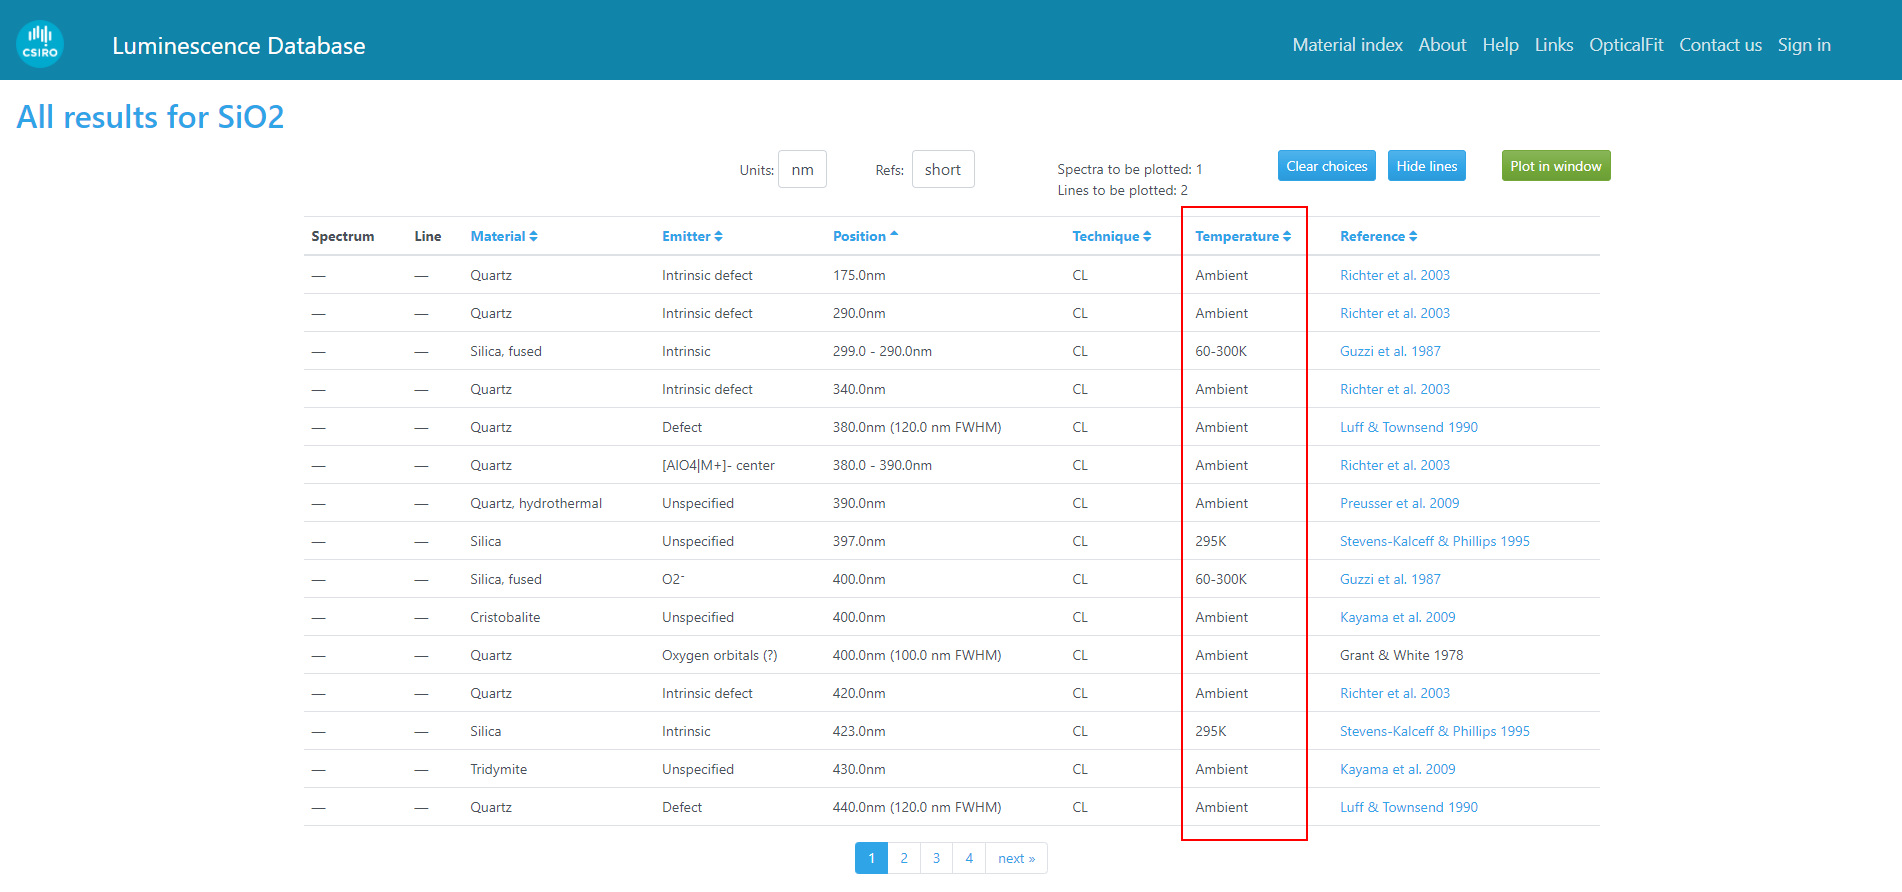
If the selected search terms return emission line or spectrum results from more than one material, the results table will contain a Material column that lists the name of the material corresponding to the emission line or spectrum result, including material variant, if applicable (e.g. 'apatite, fluor', or 'alumina, nanopowder').
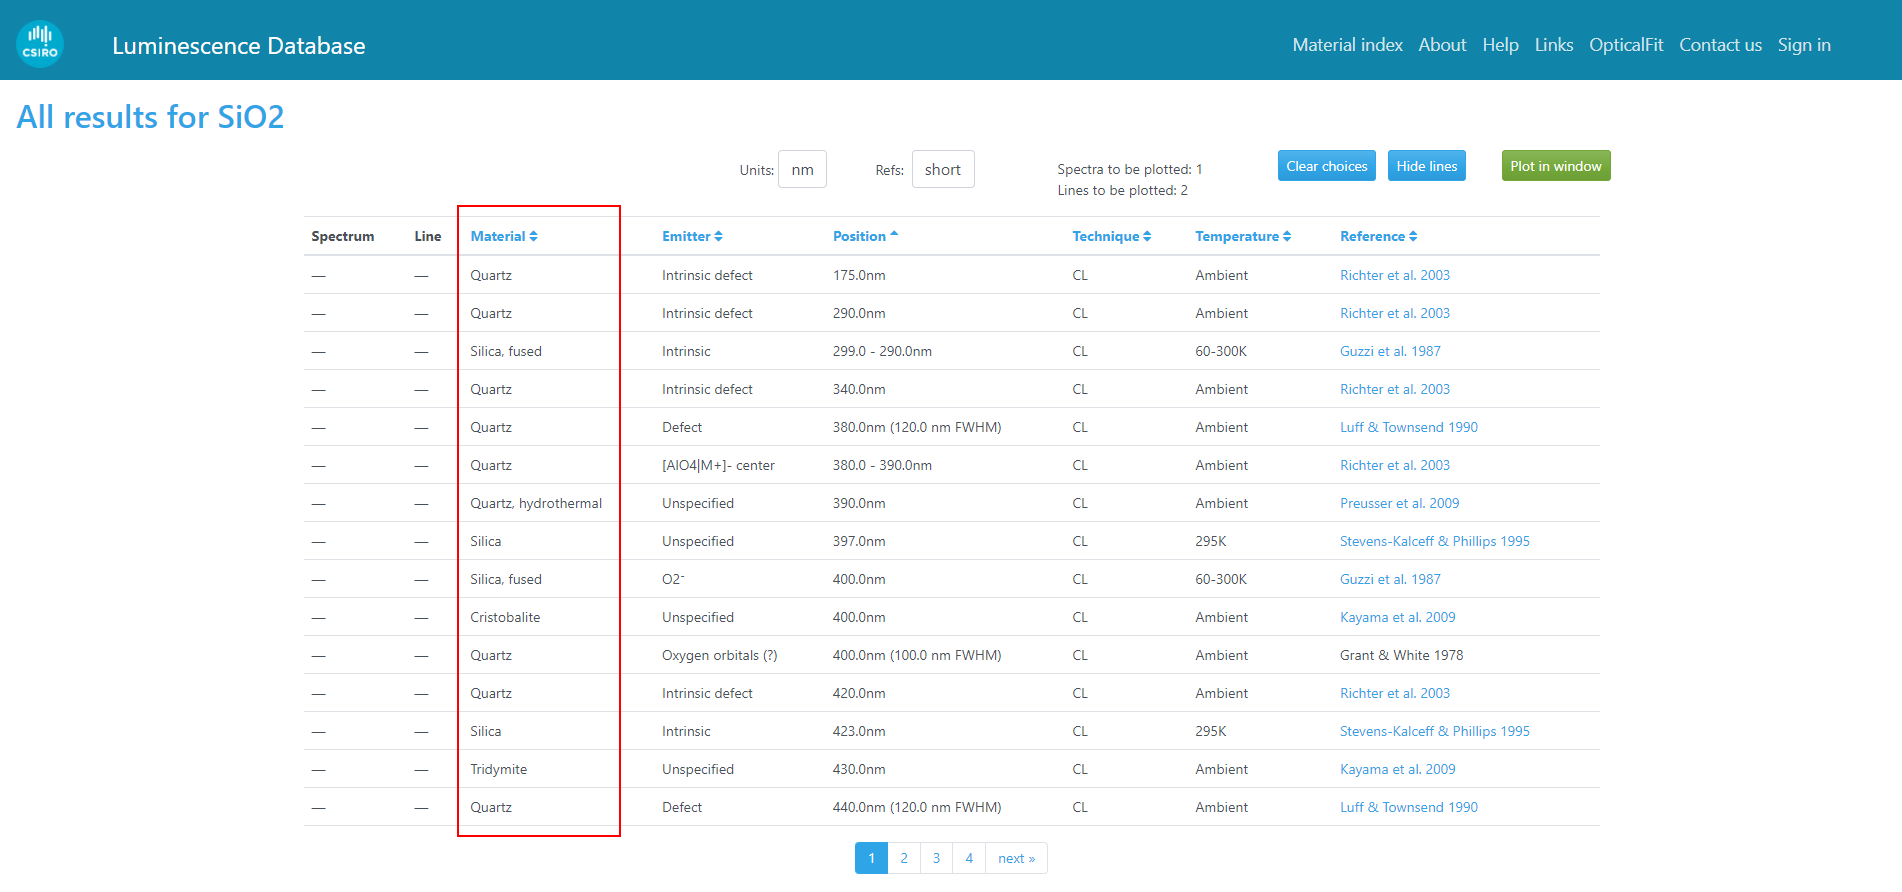
The 'Material' column, showing the different materials and variants returned with a search for the formula SiO2.
Emitter column
When searching for emission lines in the luminescence database, the Emitter column in the results table will list the emitter (and charge, if applicable) of the luminescence center responsible for the emission line.
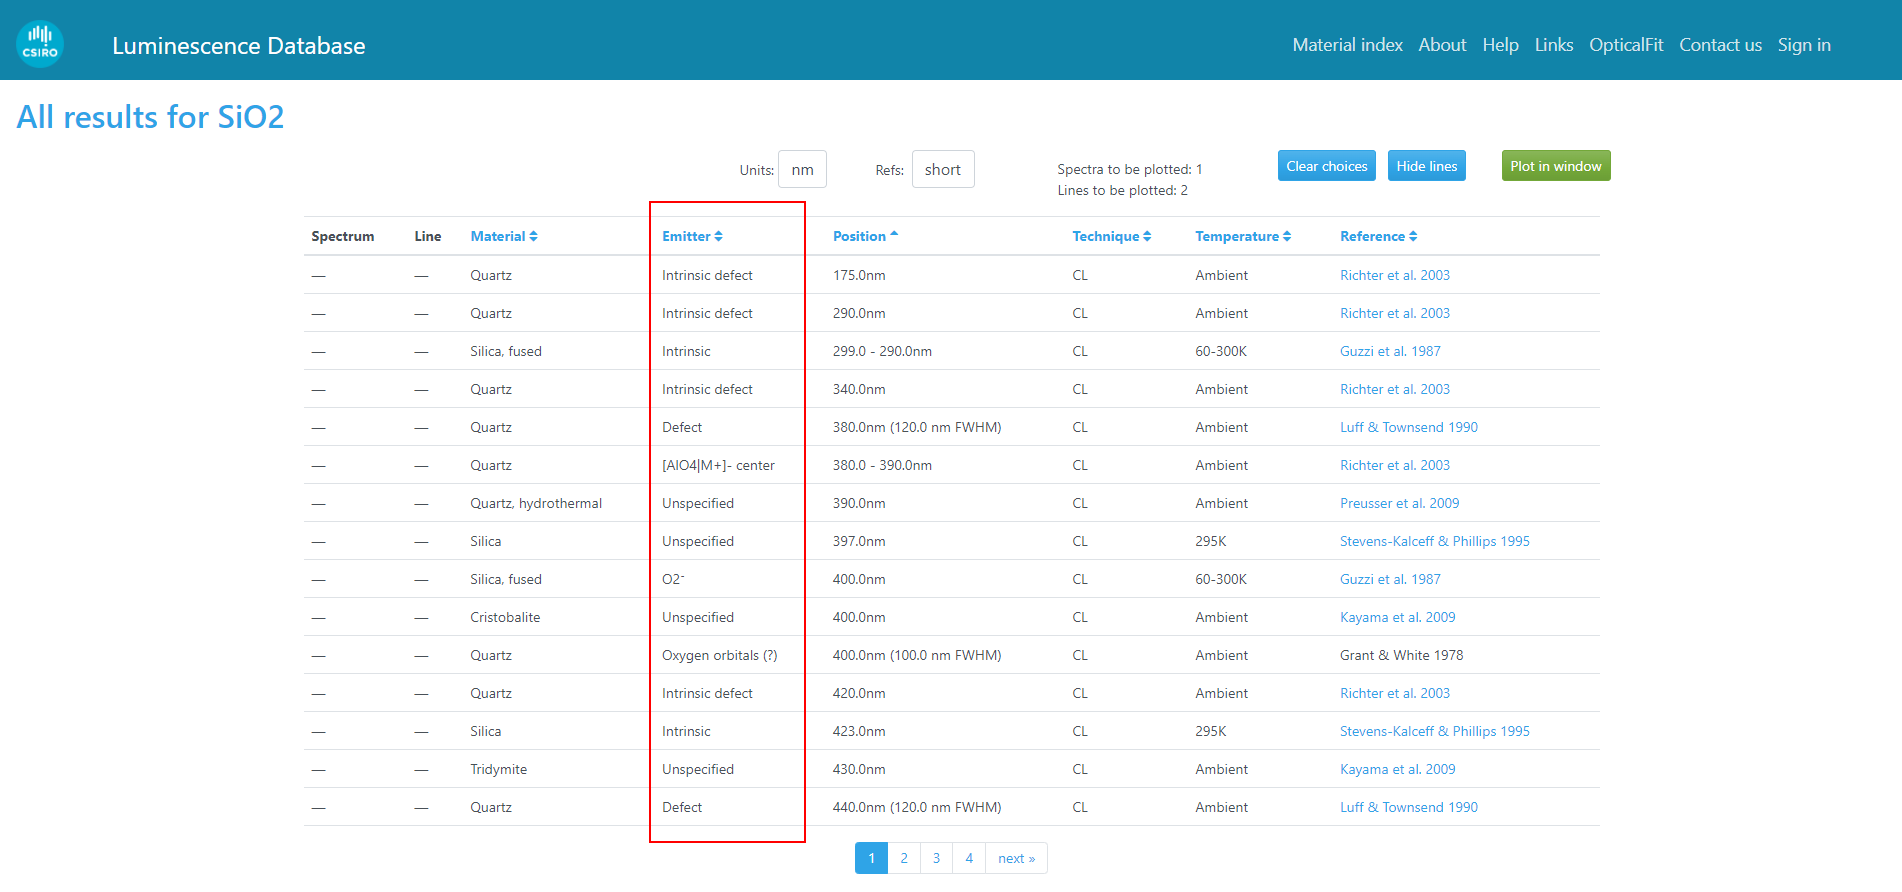
The 'Emitter' column, showing a range of luminescence centers in silica.
The emitter text value is often simply an extrinsic dopant element (e.g. Mn, Dy, etc.), or an easily recognisable emission centre (e.g. F-center, self-trapped exciton, etc.). However, some emission centres are reported only for a small subset of materials, and therefore may have very specific and potentially unfamiliar notation, the interpretation of which cannot be easily stored in or conveyed by this database. In such cases, users are recommended to consult the original publication using the link in the Reference column. Furthermore, the complex mark-up (superscripts/subscripts/etc.) used for some emitters cannot always be adequately represented in the database interface, and thus it may be necessary to examine the original paper to resolve possible ambiguity in the identity of the emitter.
Position column
If searching for emission lines, the position of each emission line (in wavelength or energy) will be displayed in the Position column. The physical units for the position values may be either nanometres (nm) or electron-Volts (eV), and may be selected using the Units dropdown list.
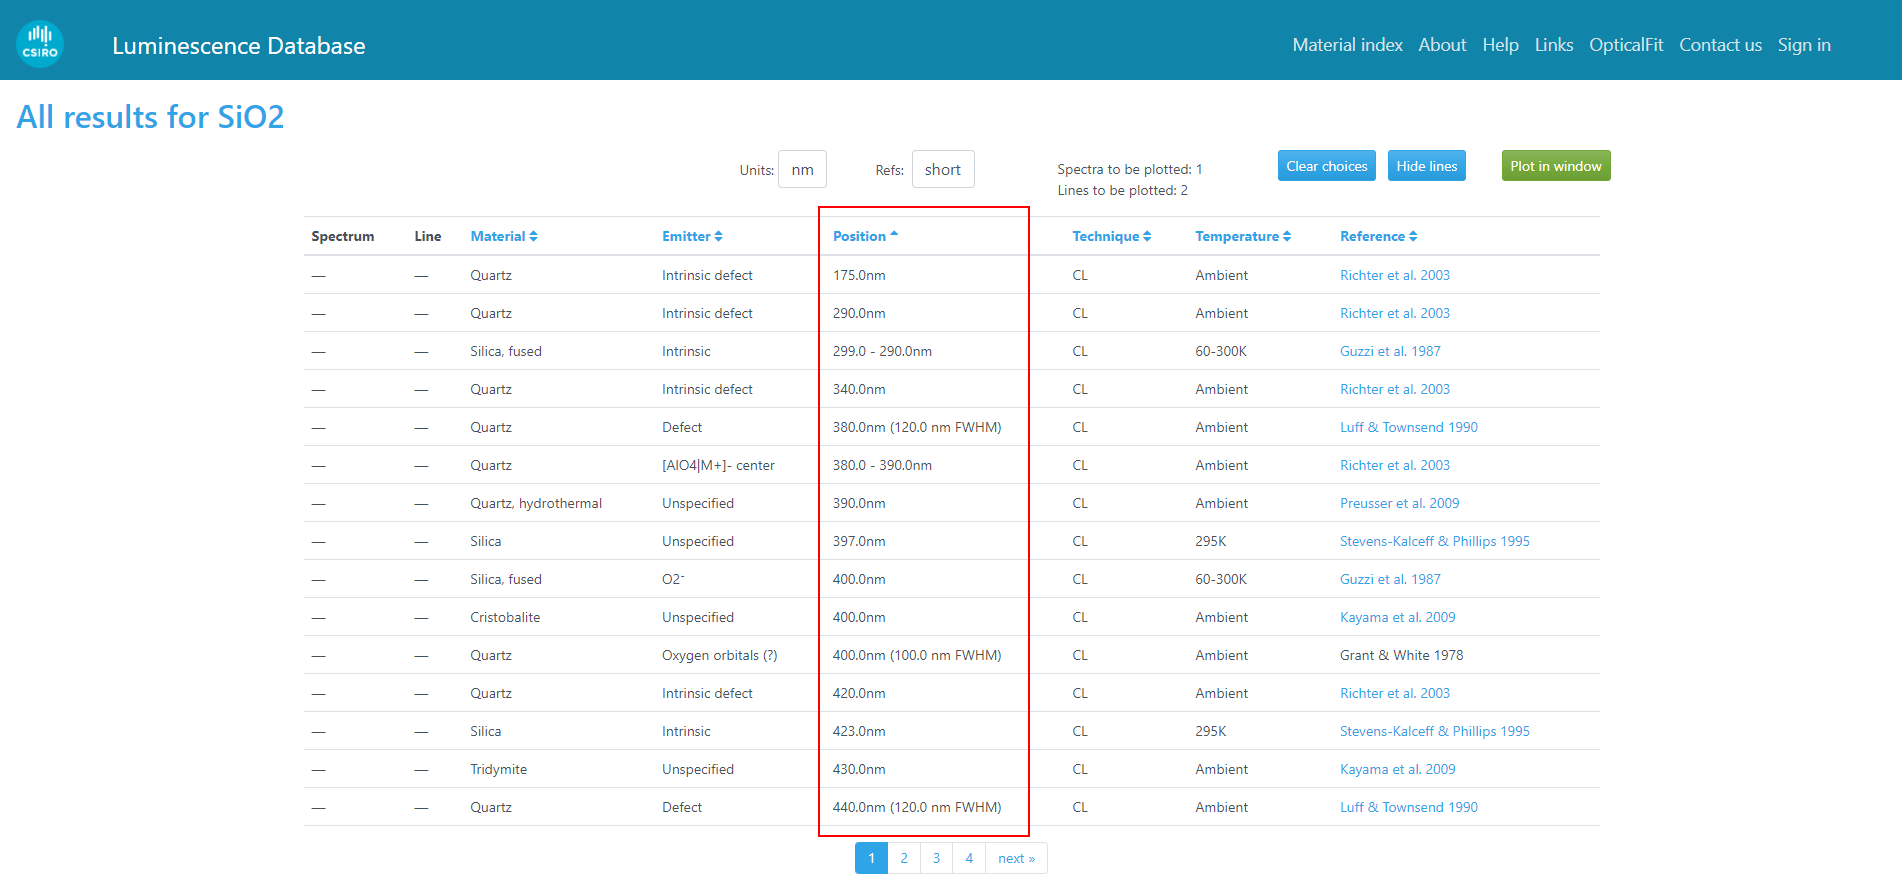
The 'Position' column displays the wavelength or energy of the emission line or band, as well as the full width at half maximum (FWHM), if known.
Lines, peaks and bands
Depending on the information provided by the original reference for the emission line, the position of the emission line may be displayed in one of three styles:
- If the emission line was reported as a broad band, the start and end coordinates of the band will be displayed (e.g. "380.0 - 390.0nm").
- If the emission line was reported as a peak with a measured full width at half-maximum (FWHM), the position and FWHM of the peak will be displayed (e.g. "380.0nm (120.0nm FWHM)").
- Otherwise, the position of the line will be displayed (e.g. "379.0nm").
Units
The position of emission lines may be displayed in terms of wavelength (as nanometres, nm) or energy (as electron-Volts, eV). The physical units for the position values may be either nanometres (nm) or electron-Volts (eV), and may be selected using the Units dropdown list.
Changing the position units from nm (for wavelength) to eV (for energy) using the 'Units' dropdown list.
Note: The Units dropdown list is only available when searching for luminescence emission lines or spectra. SXES spectra are always plotted in units of eV.
Technique column
The analysis technique used to measure the spectrum or emission line is shown in the Technique column, as shown below.

The 'Technique' column lists the analysis technique used to measure the emission line or spectrum.
The Technique column shows abbreviations of the analysis technique, including:
| Abbreviation | Technique |
|---|---|
| CL | Cathodoluminescence |
| CL/SEM | Cathodoluminescence, in a scanning electron microscope |
| CL/TEM | Cathodoluminescence, in a transmission electron microscope |
| CL/FloodGun | Cathodoluminescence, using a flood-gun electron source |
| CL/OM | Cathodoluminescence, in an optical microscope |
| IL | Ionoluminescence |
| PL | Photoluminescence |
| PL/Laser | Photoluminescence using a laser source |
| PL/UV | Photoluminescence using an ultraviolet source |
| PL/XL | Photoluminescence using an x-ray source |
| TL | Thermoluminescence |
| SXES | Soft x-ray emission spectroscopy |
Note: The Technique column is only shown when searching for luminescence emission lines or spectra. The technique for SXES spectra is necessarily "SXES".
Temperature column
The Temperature column displays the temperature of the specimen during the measurement of each emission line or spectrum, if this information was provided in the original publication.
The 'Temperature' column shows the specimen temperature for the measurement of the emission line or spectrum, if reported in the original publication.
Reference column
The Reference column lists the original source publication for the emission line or spectrum search result.
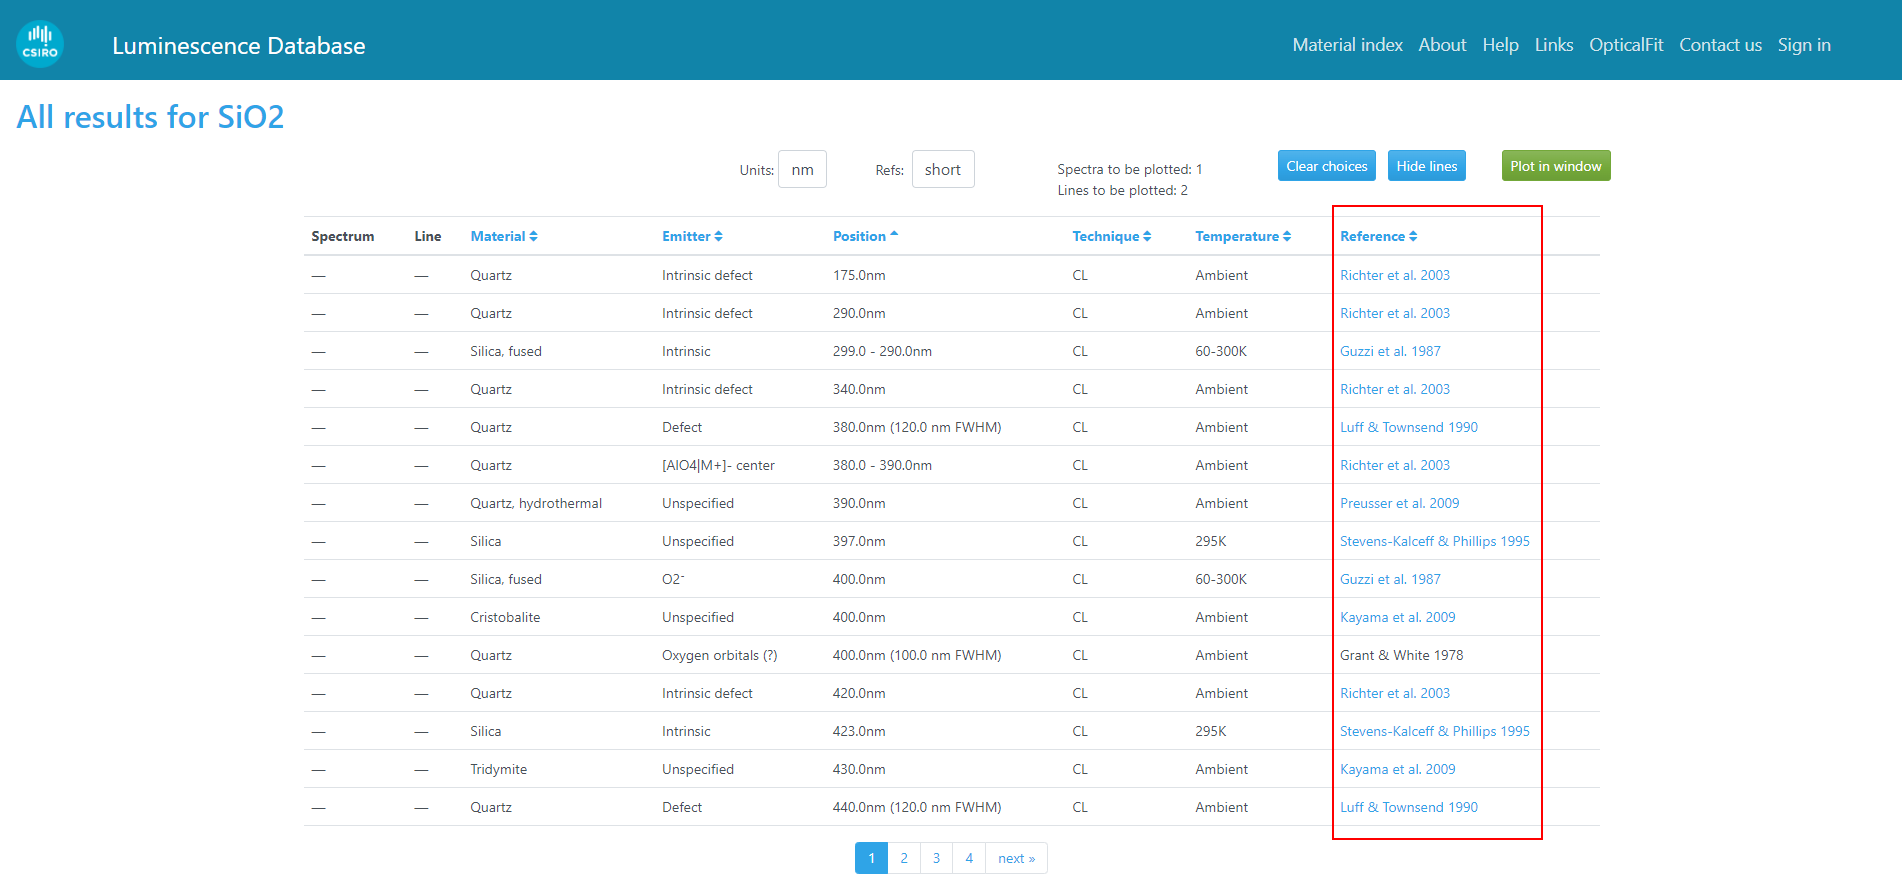
The 'Reference' column shows an abbreviated citation for the original publication of the emission line or spectrum, and is a clickable link to the DOI or publisher's website (if available).
If the reference has an associated URL in the form of a DOI or link to the publisher's website, the text in this column will be a clickable hyperlink which allows users to read the original publication (subject to journal access, institution subscriptions, etc.)
By default, the Reference column displays an abbreviated citation containing the first one or two authors, and the publication year. The full citation may be viewed by selecting the "Long" value in the Refs dropdown list, as shown below.
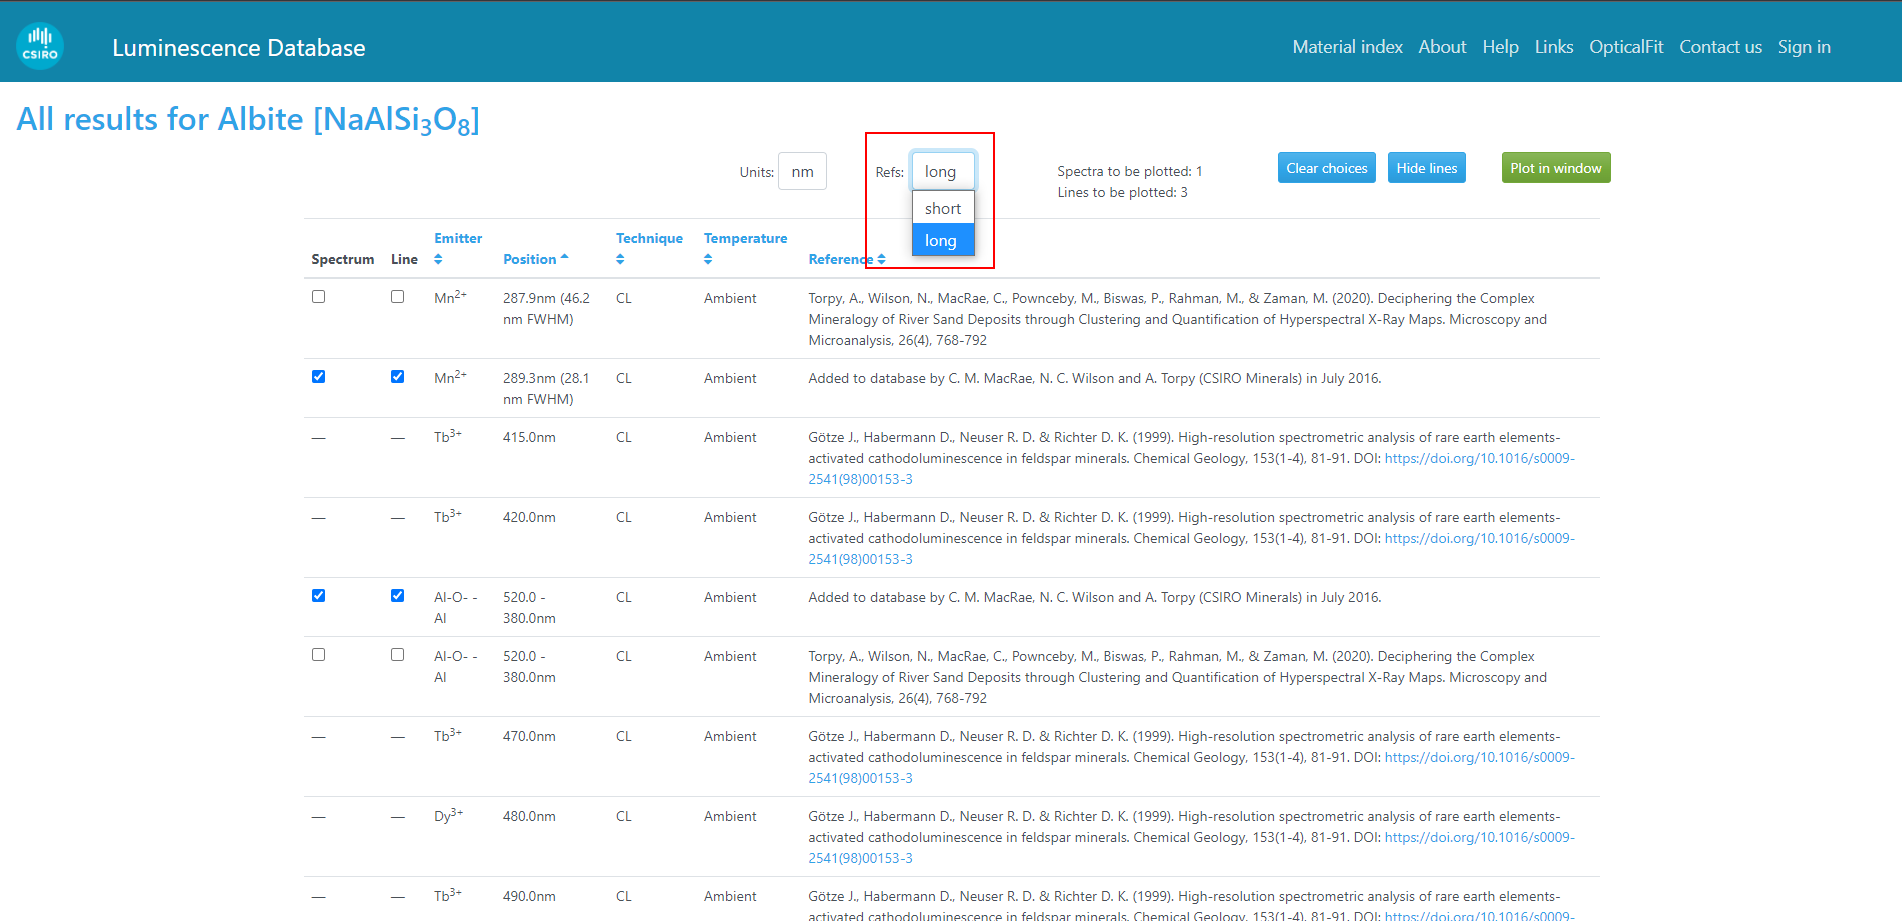
Using the 'Refs' dropdown list to change the display of the references column from short (abbreviated) to long (full publication citation).
A small set of references in the database are used to represent otherwise unpublished spectra and emission lines measured from standard reference materials at the CSIRO Mineral Resources Microbeam Laboratory, in Clayton, Victoria, Australia. These references are:
- CSIRO spectra [2011-2021] — 109 cathodluminescence spectra, 551 emission lines
- CSIRO SXES database — 145 soft x-ray emission spectra
Column sorting
The contents of the results table may be sorted in ascending or descending order (or alphabetical / reverse-alphabetical) by clicking on the up or down arrows after each column title.

The header of the results table, showing up and down arrow controls for forwards/reverse sorting of table contents.
Conducting a new search
To conduct a new search, you may either click on the back button in your web browser, or on the Luminescence Database title at the top-left of the results page.
Transmission Correction
The components that make up the light collection and detection system (CCD, grating, fibre, mirrors, and lenses) all have differing transmission responses. These responses can be measured and used to correct the measured optical signal. When transmission corrected spectra are available, a “Transmission corrected” selection tool will become available which allows filtering of results to show all spectra, or just corrected or uncorrected spectra.
4. Using the spectrum plot
The spectrum plot is displayed on the results page below the results table when the search results contain at least one spectrum.
The spectrum plot on the results page, showing the selected spectra and peaks from the results table.
Adding or removing spectra
You can add or remove spectra from the spectrum plot using the checkboxes in the Spectrum column.
Clear choices button
To remove all spectra and lines from the spectrum plot, select the Clear choices button.
Comparing spectra from different materials
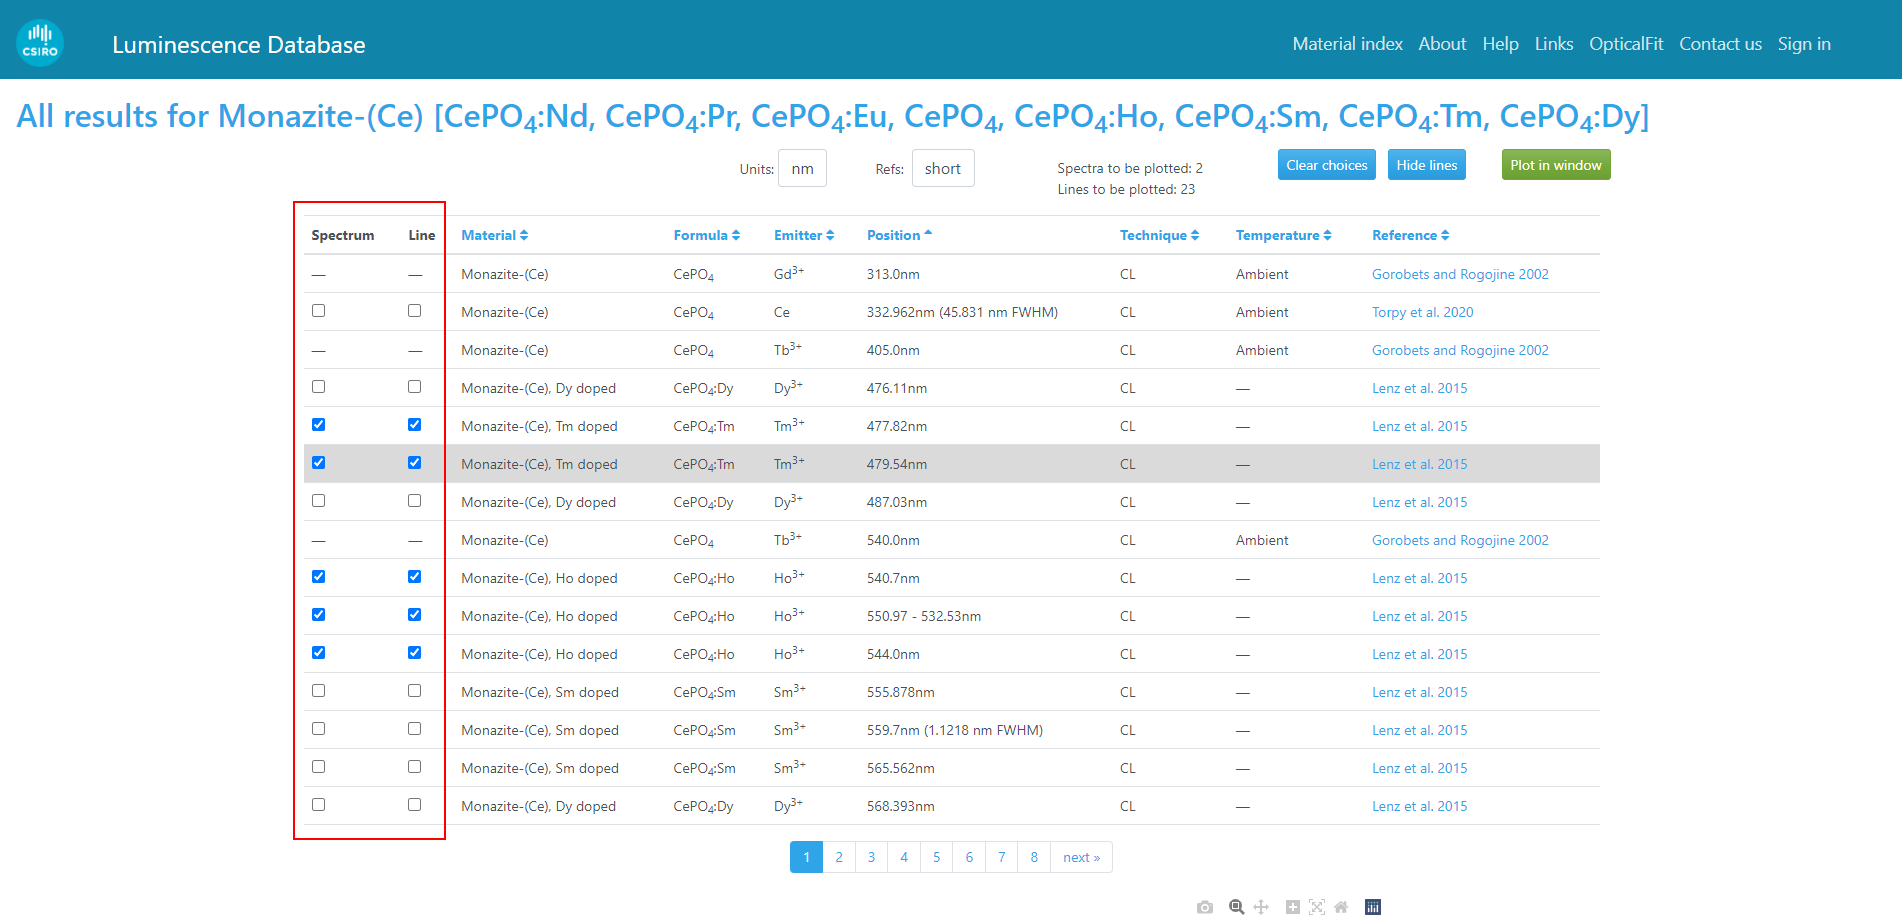
To compare the spectra of different materials, simply use the search page to search for the spectra of each material one by one (see examples for luminescence or SXES spectra), each time ensuring the checkbox in the Spectrum column is checked for the spectra to be shown. The example below shows SXES spectra from five different phosphate materials.
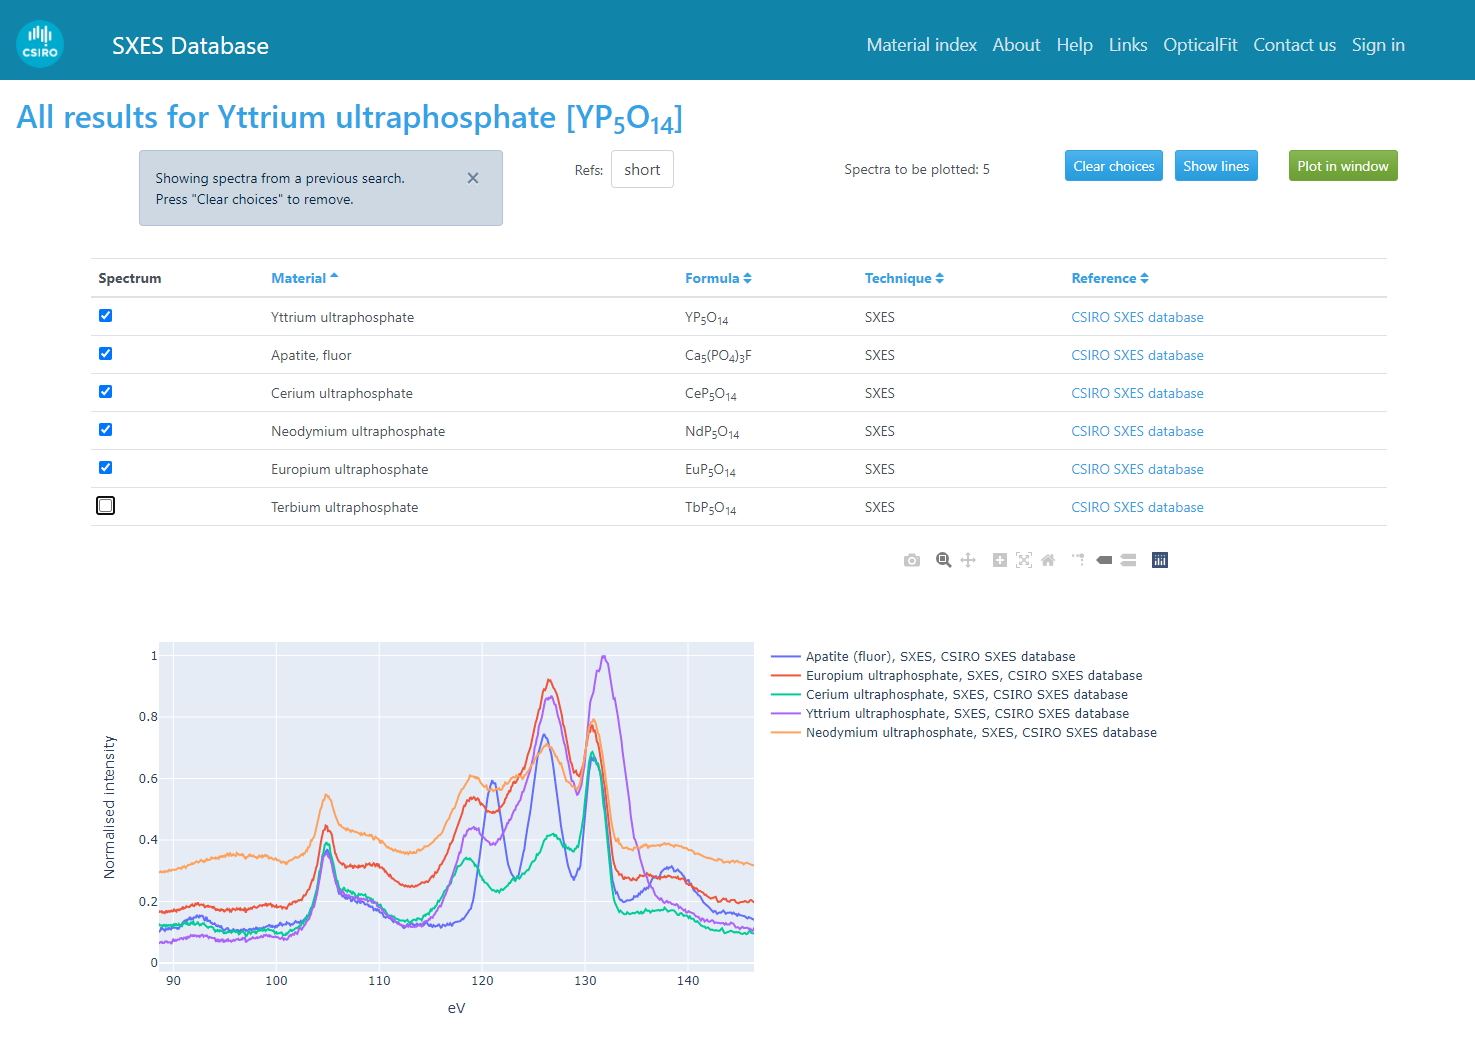
Comparing spectra from different materials using the 'Spectrum' checkbox column to accumulate spectra from multiple searches.
To clear all spectra, press the Clear choices button.
Units in the spectrum plot
Spectra may be plotted in terms of wavelength, in units of nanometres (nm), or in terms of energy, in units of electron-Volts (eV), and this may be changed using the Units dropdown list control.
The wavelength and energy of a photon is inversely related by the Planck-Einstein relation E = hν = hc/λ, where E is the photon energy (in Joules), h is Planck's constant (6.62607015×10⁻³⁴ J·Hz−1), ν is the frequency of the photon (in Hz), and c is the speed of light in vacuum (299,792,458m/s), and λ is the wavelength of light (in metres).
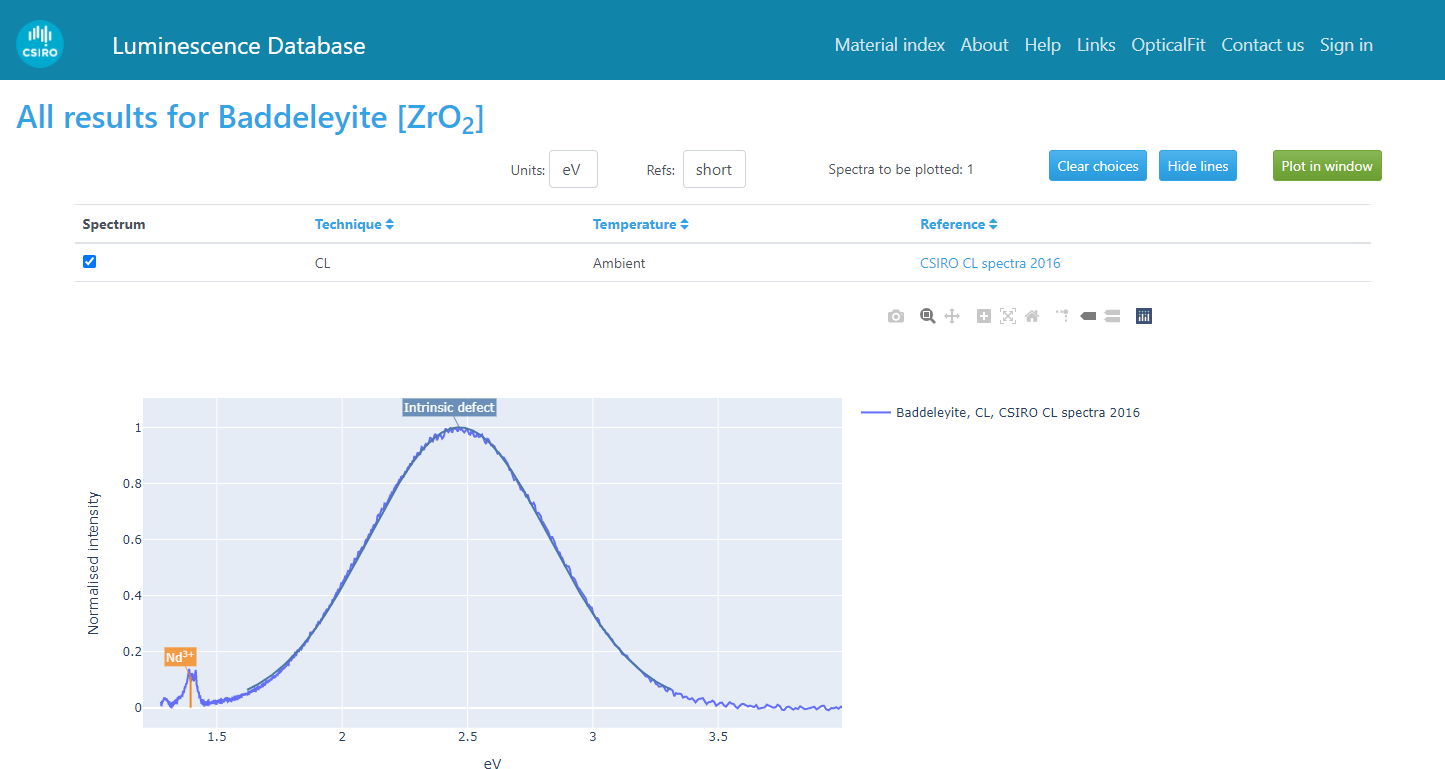
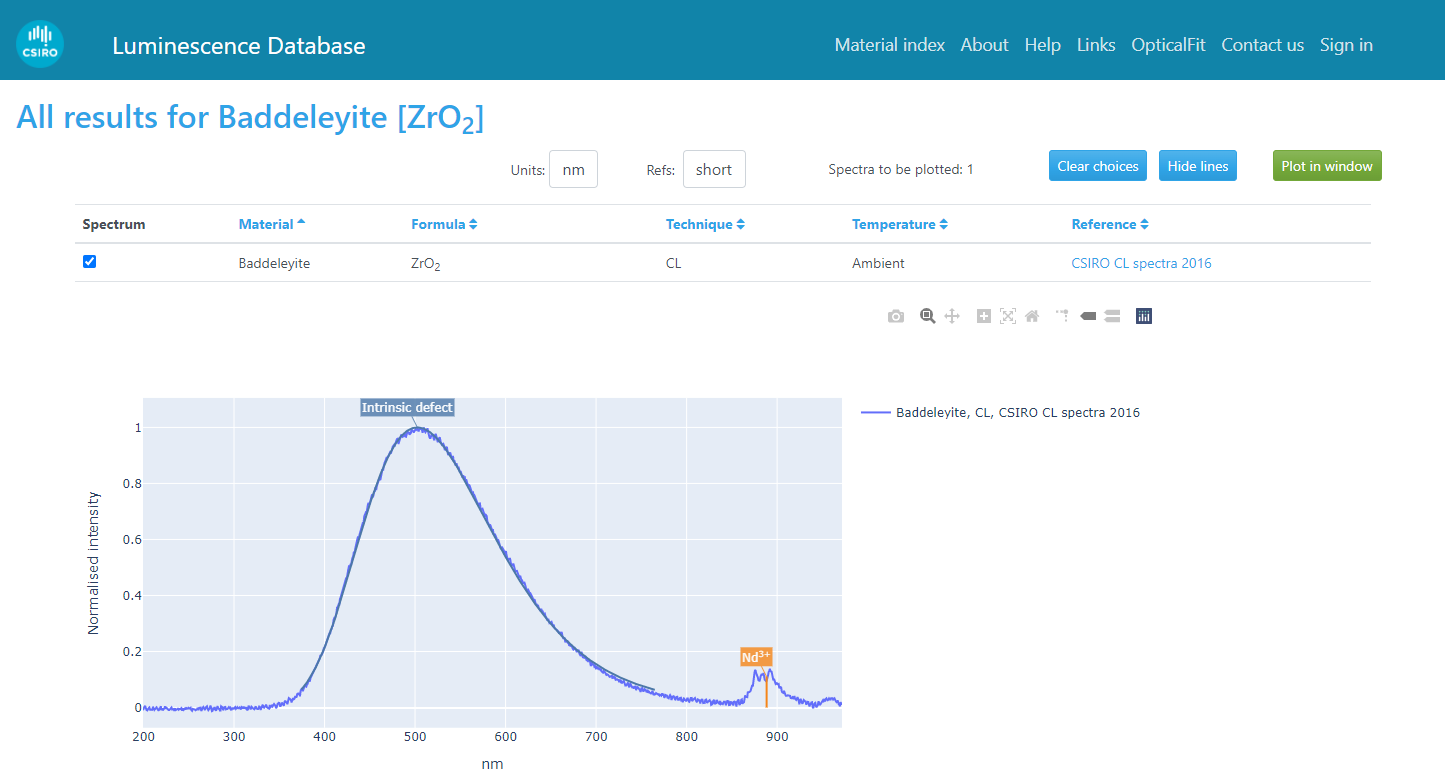
Note that the Planck-Einstein equation is a hyperbolic relationship, where E ∝ 1/λ. Consequently, changing between energy and wavelength units in the spectrum plot will reverse the spectrum plot (small energies are large wavelengths, and vice versa). Furthermore, the relative spacing of lines or other spectral features will change. For example, equally spaced lines positioned at 1, 2 and 3eV will convert to unequally spaced lines at 1239.8, 619.9 and 413.3nm, respectively. Thus, phonon series, which are equally spaced in energy will be unequally spaced if plotted in wavelength. Furthermore, emission peaks with significant linewidths dominated by lifetime broadening will exhibit a symmetric peak profile in terms of energy (see intrinsic peak in baddeleyite, ZrO2, as shown below-left), which will be asymmetric if plotted in terms of wavelength (below right).
|
|
| CL spectrum of baddeleyite (ZrO2) plotted in terms of photon energy (units of eV), showing symmetric lifetime broadening. | The same CL spectrum of baddeleyite, showing an assymmetric peak profile when plotted in terms of wavelength. |
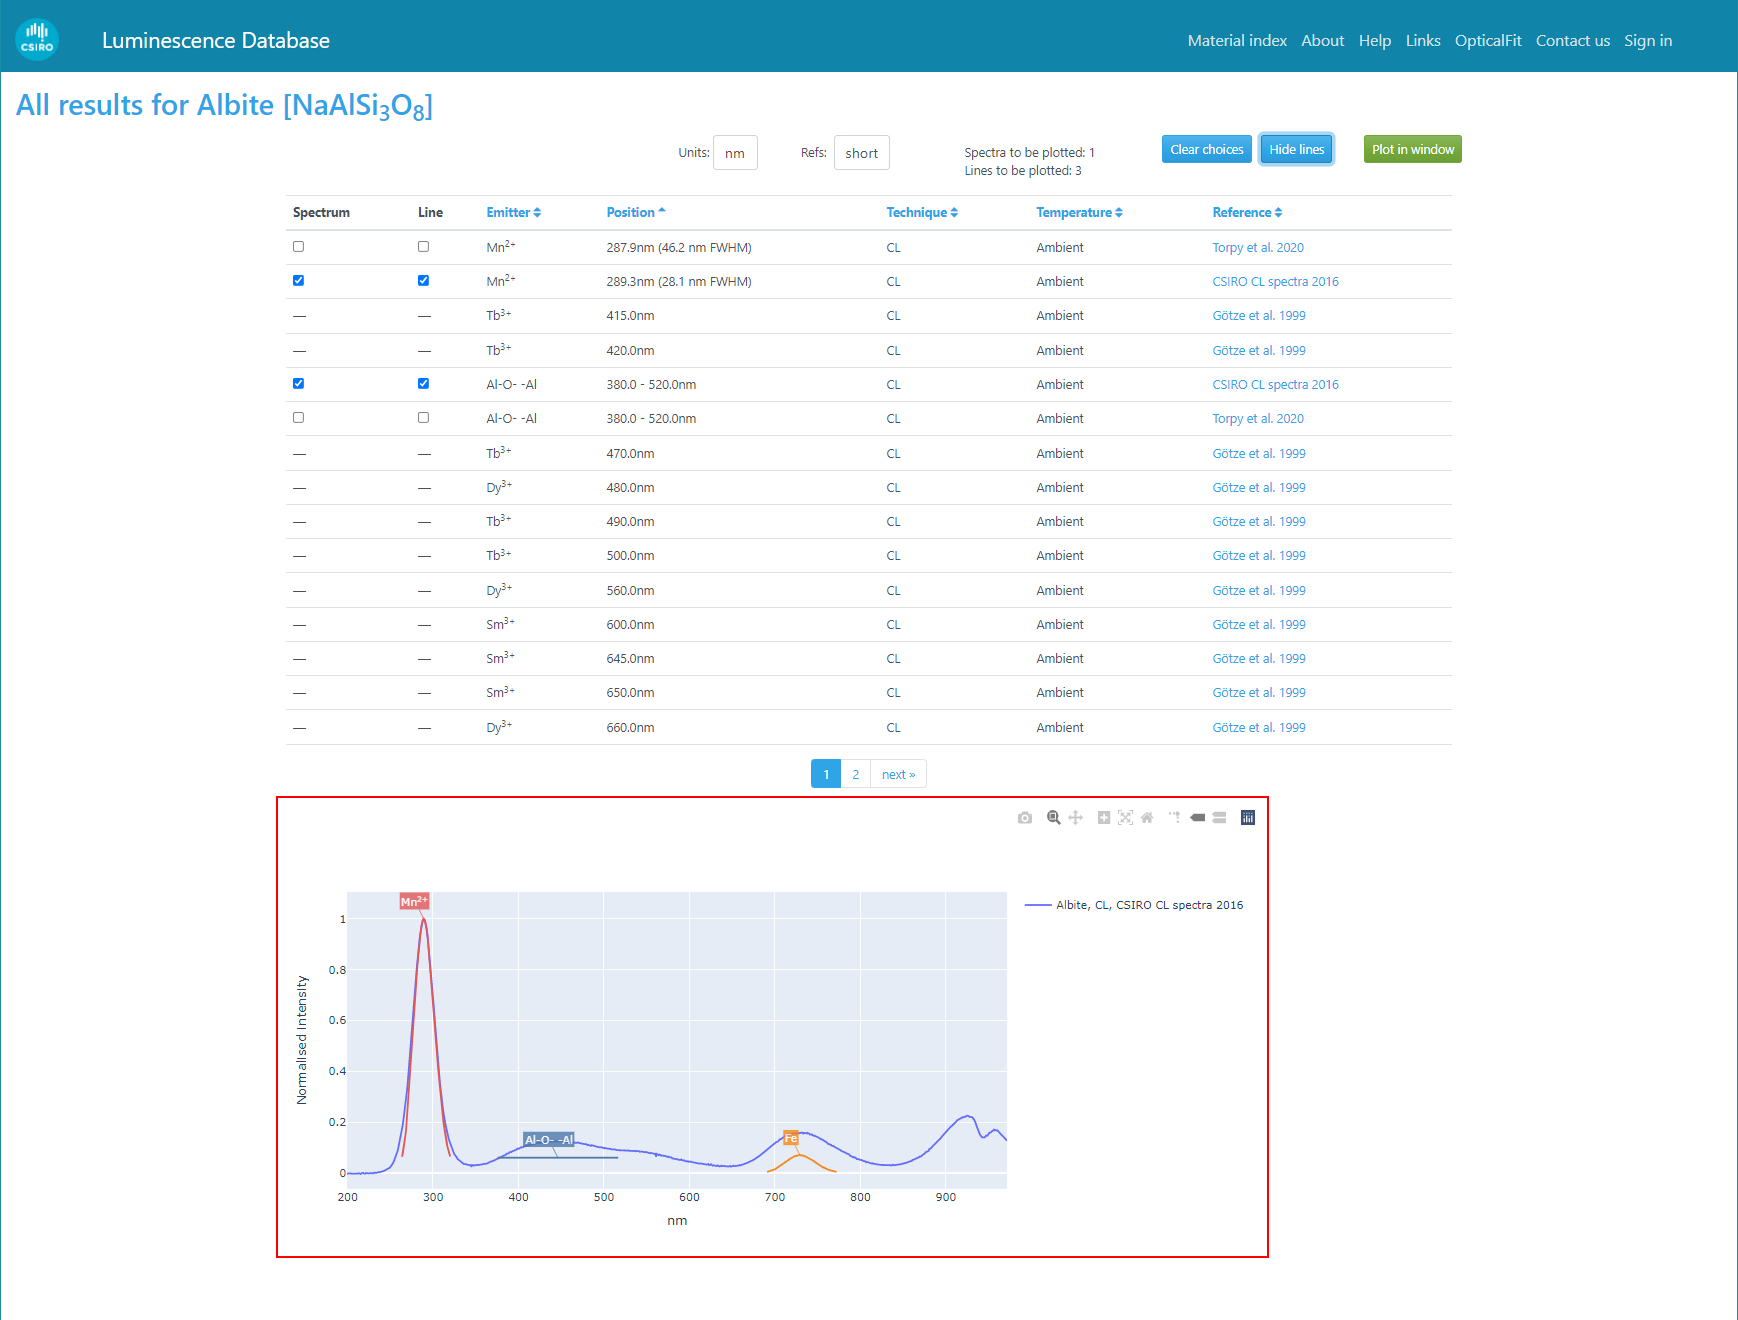
Peak overlays
The spectrum plot can display emission lines associated with spectra.
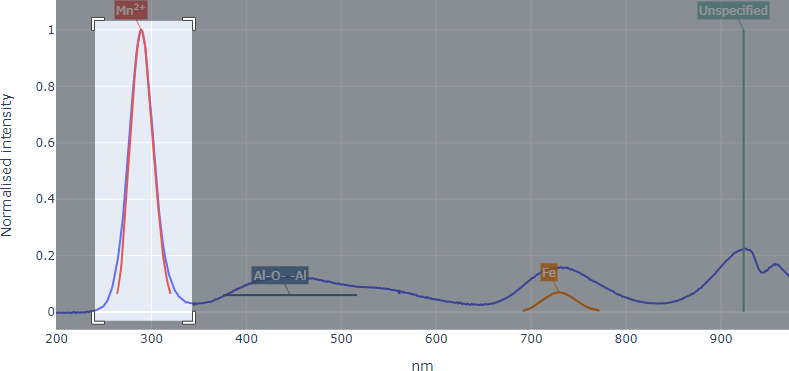
- Emission lines with defined full width at half maximum (FWHM) are displayed as a Gaussian peak (e.g. Mn2+ and Fe peaks in plot below).
- Emission bands are displayed as a horizontal line between the specified start and end of the band (e.g. Al-O--Al band in plot below).
- Emission lines with no defined FWHM are displayed as simple vertical lines (e.g. line with unspecified emitter, shown below).
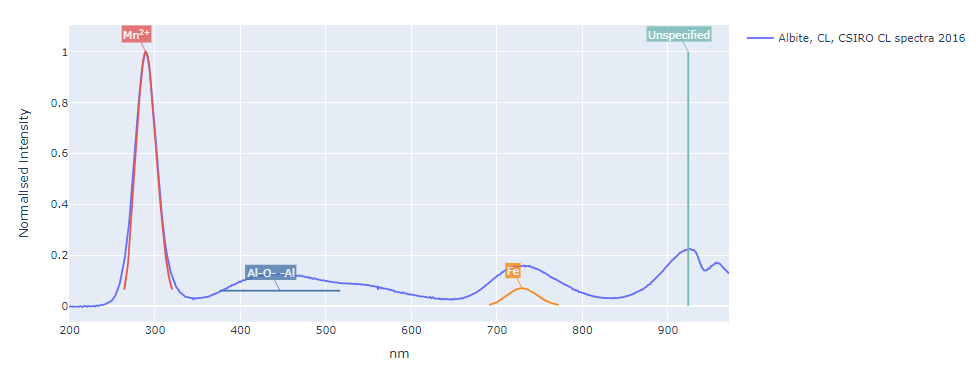
Peak overlays on the spectrum plot, showing the three distinct display types (peaks, bands and lines).
If the original publication provided a relative peak height for the emission line, that will be used when drawing the peak overlay. If no relative peak height is given, the peak marker will be displayed at full height.
For peaks with a defined FWHM, the peak profile used for the display will be calculated in terms of the energy or wavelength units specified in the original publication. Thus, if a peak was was reported with a position and width measured in energy units, the peak profile will be symmetric in energy, and likewise peaks with positions and width measured in wavelength units will be symmetric in wavelength. Because wavelength and energy inversely related (see discussion of units), a distribution that is symmetric in one quantity will be asymmetric in the other. Thus, the peaks displayed in the spectrum plot will only be symmetric in if the units of the spectrum plot are the same as the units in the original publication that reported the peak position and width.
Show lines and Hide lines button
The line/peak overlays may be shown or hidden using the Show lines and Hide lines buttons, which are displayed above the spectrum plot on the results page.
Spectrum plot toolbar and controls
Immediately above the spectrum plot is a toolbar of buttons, the use of which is explained below:
| Toolbar button | Description |
|---|---|
| Save the current spectrum plot as a portable network graphic (PNG) image file. |
| Set the mouse mode to zoom, so that a left-click-and-drag will zoom in on the rectangle defined by the start and end points of the mouse drag (see zoom controls). |

| Set the mouse mode to pan, so that a left-click-and-drag will pan the display (scrolling in x- and y-axes), without changing the zoom. |

| Step the zoom in for both the x- and y-axes. |

| Step the zoom out to show the entire spectrum. |

| Step the zoom out to show the entire spectrum. |

| Toggle on or off the display of spike lines, which are vertical and horizontal lines from the mouse cursor to the x- and y-axes. For more information, please see Spike lines. |

| Toggle on or off the display of the x- and y-axis coordinates of the spectrum channel nearest to the mouse cursor position. This is mutually exclusive with the Compare data on hover mode (next button to the right). For more information, please see Show closest data on hover. |

| Toggle on or off the display of the y-axis coordinates for all spectra at the x-axis coordinate of the mouse cursor position. This is mutually exclusive with the Show closest data on hover mode (previous button to the left). For more information, please see Compare data on hover. |
Zoom controls
With the Zoom mouse mode (see Zoom toolbar button, above), the user may zoom-in on a specific region of the spectrum plot by clicking on the left mouse button, then dragging the mouse over the desired rectangle, and releasing the mouse button, as shown below.
|
|
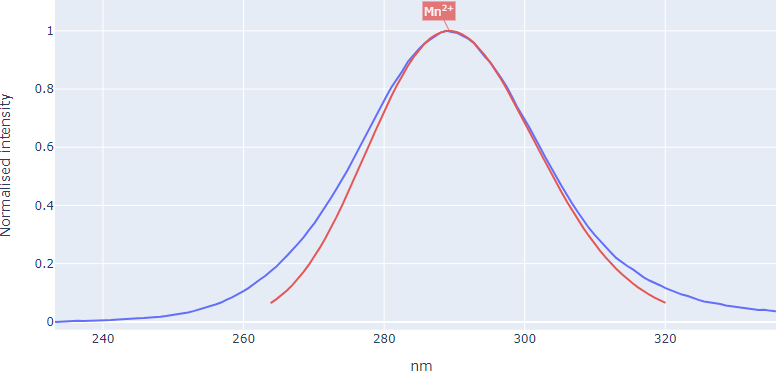
| Selecting the zoom rectangle by clicking the left mouse button and dragging. | The re-calculated spectrum plot after the left mouse button was released in the zoom click-and-drag operation shown in the preceding plot. |
To zoom out, please use the Reset axes toolbar button.
Spike lines
The Spike lines toolbar button toggles on or off the display of 'spike lines', which are vertical and horizontal lines from the mouse cursor to the x- and y-axes, as shown below.

The 'Spike lines' mode in the spectrum plot, showing horizontal and vertical axes from the mouse cursor to the x- and y-axes.
Show closest data on hover
The Show closest data on hover toolbar button toggles on or off the display of the x- and y-axis coordinates of the spectrum channel nearest to the mouse cursor position, as shown below.
The 'Show closest data on hover' mode in the spectrum plot, showing the x- and y-axis coordinates of the spectrum channel nearest to the mouse cursor (at the point labelled "589.727, ...".)
Note: This option is mutually exclusive with the Compare data on hover mode, described below.
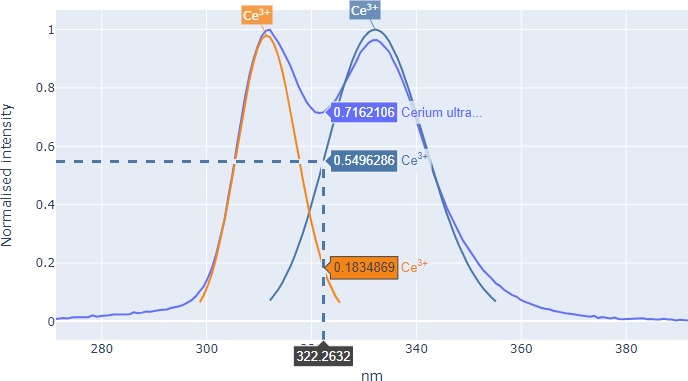
Compare data on hover
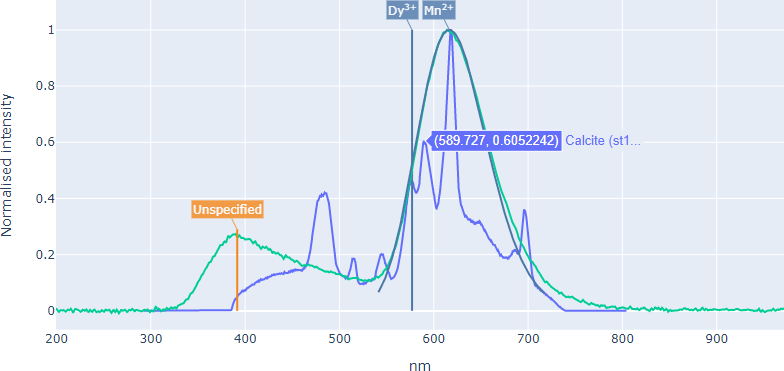
The Compare data on hover toolbar button toggles on or off the display of the y-axis coordinates for all spectra at the x-axis coordinate of the mouse cursor position, as shown below.
The 'Compare data on hover' mode in the spectrum plot, showing the y-axis values of all spectra and peaks in the spectrum plot at the x-axis coordinate of the mouse cursor. Note spike lines are also shown in this figure to indicate the x- and y-axis position of the mouse cursor.
Note: This option is mutually exclusive with the Show closest data on hover mode, described above.
Plot in window button
The Plot in window button, located above the spectrum plot, allows the user to enlarge the spectrum display to cover the full browser window area. To return to the results page afterwards, please use the back button in your browser.
5. Material index page
To browse an alphabetical the list of materials in the database, select the Material index link in the site menu, as shown below:
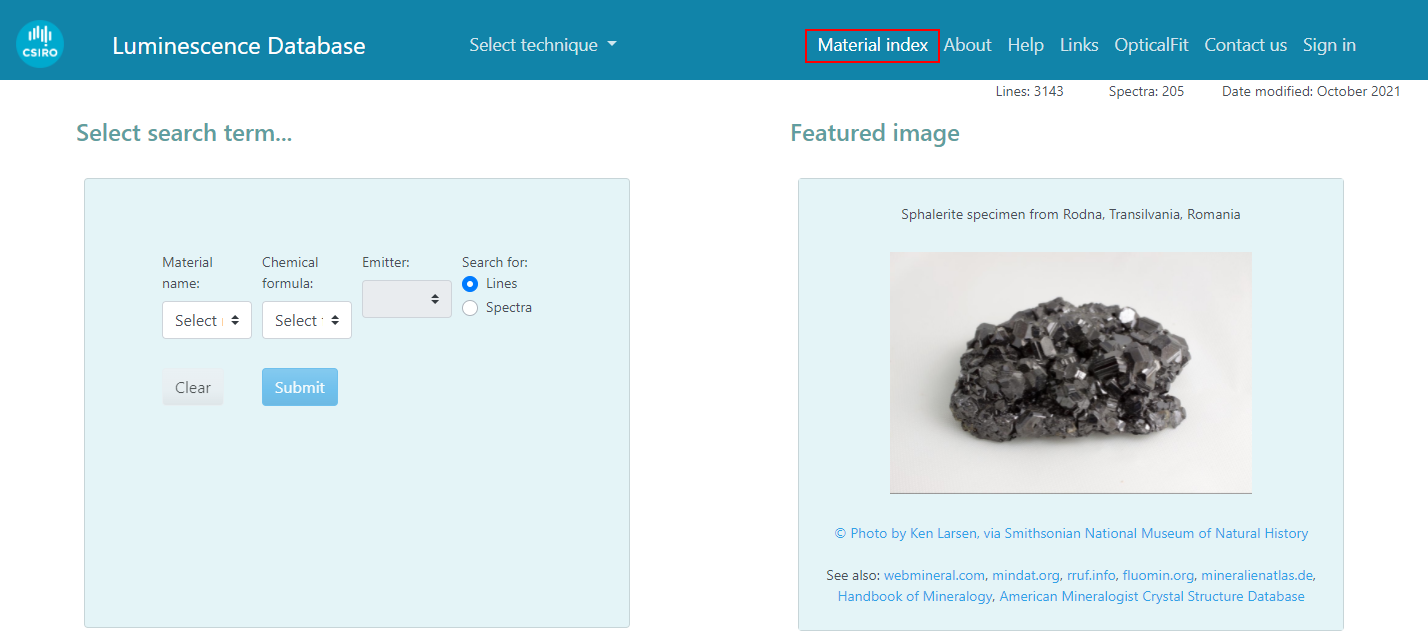
The link to the 'Material index' page in the site menu.
This link will open the Material index page, shown below:

The 'Material index' page
The Material index page allows users to browse the list of materials in the CSIRO spectroscopy database and find links to more specific information using the linked Material pages. The contents of the table on the Material index page are:
| Column name | Description |
|---|---|
| Name | The name of the material or class of materials. Note the name is a link to the material page that provides more information about the material. |
| Formula | The chemical formula of the material. |
| Classification | The parent classification for this material; typically this follows the IMA system of mineral classifications (including sub-classifications, and super-classifications). This column will include only the immediate next level up in the classification hierarchy tree. |
| Members | If this material represents a classification (or sub-classification/super-classification) of materials, this column will list the members of the classification. This column will include only the immediate next level down in the classification hierarchy tree. |
| Image | A link to an example image of this material. |
| Lines | The number of emission lines in the database measured for this material, from any technique. |
| Spectra | The number of spectra in the database measured for this material, from any technique. |
| Techniques | A list of the techniques from all the lines and spectra in the database that were measured from this material. |
| Tags | A list of arbitrary text 'tags' that describe the material. |
Clicking on the links in the material name, classification or members columns will open the material page for the selected material or classification.
Material pages
The material page summarises the information in the CSIRO Spectroscopy Database for each material, and is opened from the Material index page. An example of the material page for calcite is shown below.
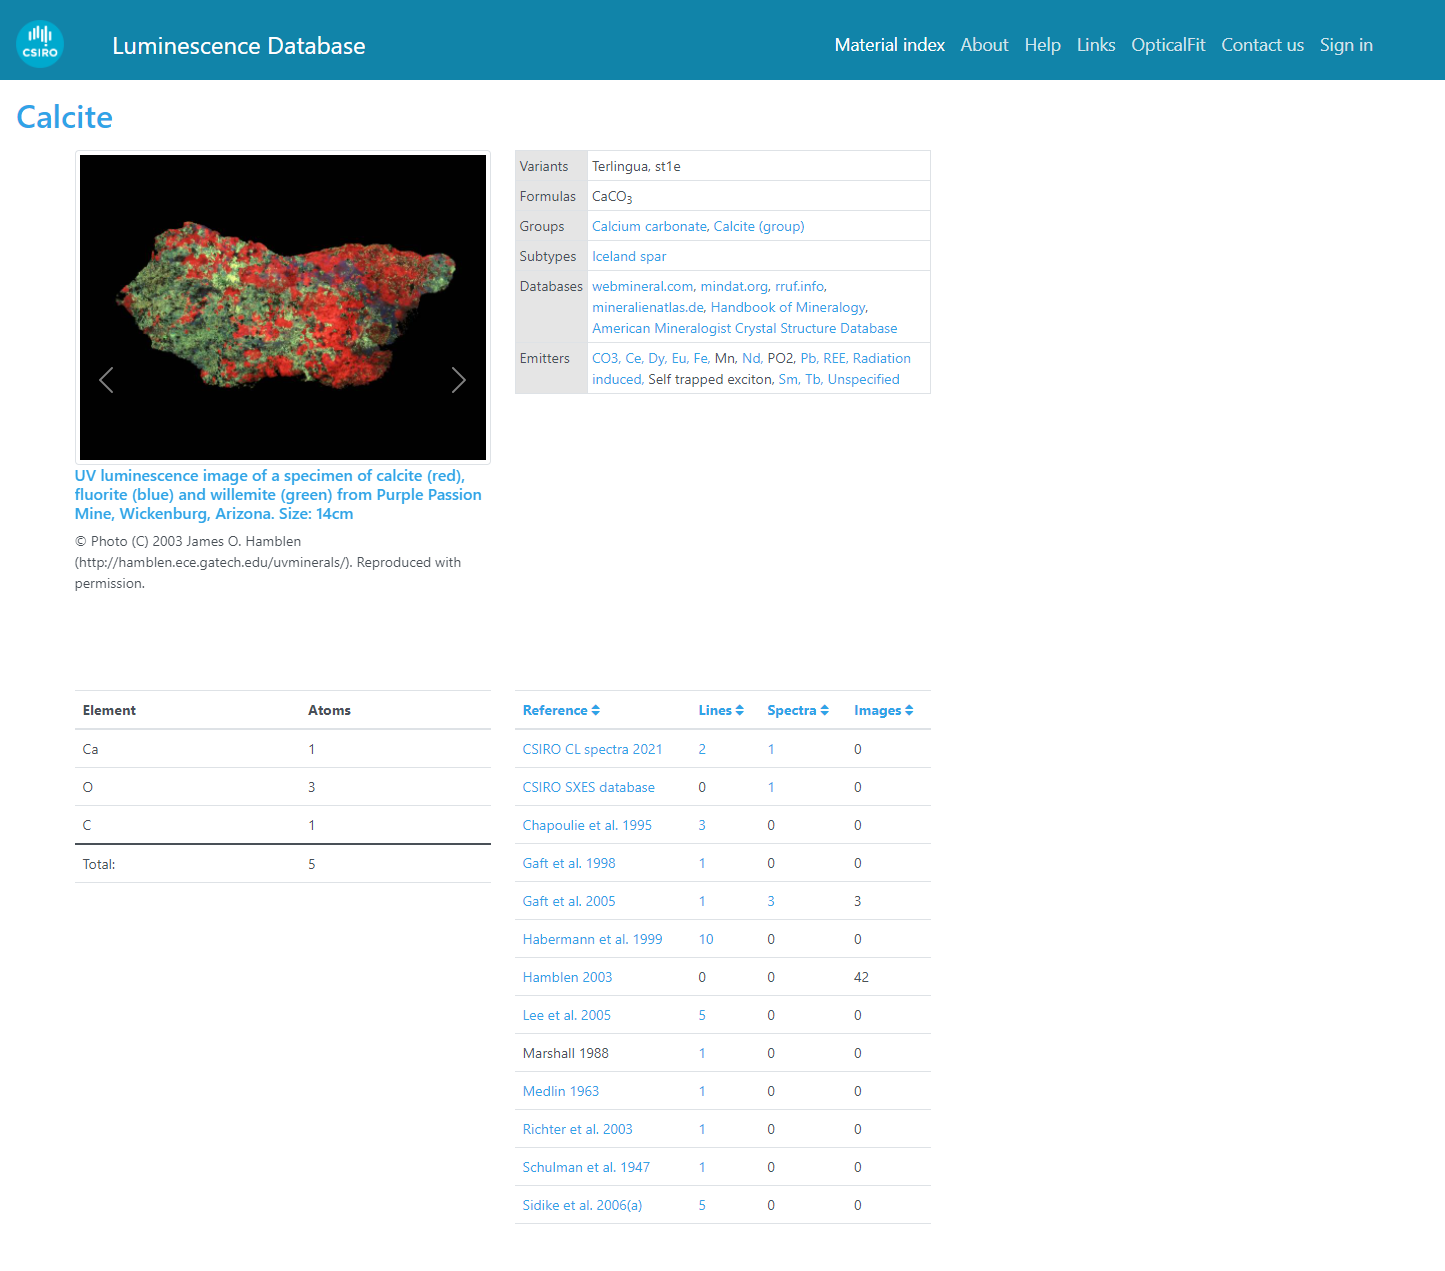
The material page, showing images, material properties, the elemental composition, and a summary of the measurements (lines, spectra, and images) from calcite.
Material images
The material image panel displays the images stored in the database for this material, and typically includes public domain or Creative Commons images of specimens, and images of spectrum plots from publications.
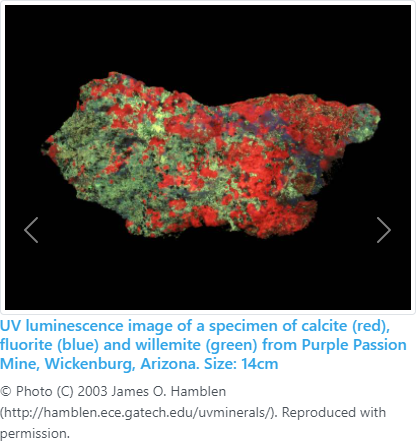
The material image panel on the material page for calcite.
Material properties
The material properties table, shown below, describes various properties of the material and provides links to search the database, links to related materials, and links to other databases for this material.
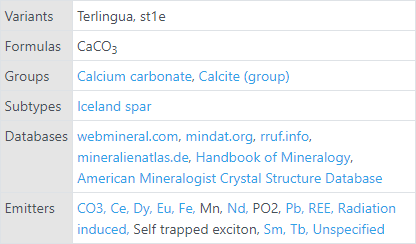
The material property table on the material page for calcite.
The properties table will include one or more of the following entries:
| Property | Description |
|---|---|
| Formula | The chemical formula of the material. |
| Variants | The names of any variants of this material which have emission lines or spectra in the database. |
| Classifications | The name of the parent classification(s) of this material. Each name is a link to the material page for the parent classification. |
| Members | The name of any members of this material. Each name is a link to the material page for the member material. |
| Luminescence emitters | A list of the emission center names for all luminescence emission lines in the database. The emitter names are direct links to the results page, which allows users to view the corresponding luminescence line positions. |
| Luminescence spectra | The number of luminescence spectra in the database for this material. The Show all spectra text is a link to the results page, which will show the luminescence spectra in the spectrum plot. |
| SXES spectra | The number of soft x-ray emission spectra in the database for this material. The Show all spectra text is a link to the results page, which will show the SXES spectra in the spectrum plot. |
| External databases | Links to further information about this material from other on-line databases about spectroscopy, mineralogy or materials science. |
Material composition
The composition table lists the elemental composition of the material, and may be displayed as atom ratios, atom percent, or weight percent.
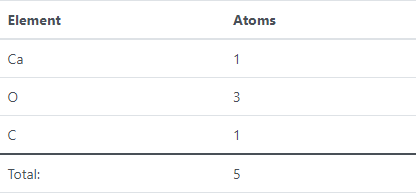
The composition table on the material page for calcite.
Note: The composition table on the material page does not yet allow users to change the units used to display the composition (e.g. atom ratios / atom percent / weight percent).
Material reference and measurement table
The reference and measurements table on the material page lists the publications in the database that included emission lines, spectra or images of the selected material (example shown below, for calcite). The text in the reference column is a clickable link to the DOI or publisher's website, allowing visitors to read the original publication. The numerical values in the Lines, Spectra, and Images columns are the number of these items in the database for the given reference and material.
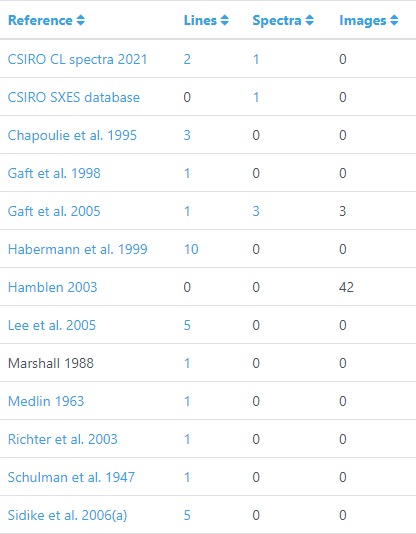
The references and measurements table on the material page for calcite, showing the number of lines, spectra and images for this material from each reference.