Florencite-(Ce) CL spectrum, 20 keV e- beam, Torpy et al. 2020
Loading...
Measurement details
| Description | CL spectrum of Florencite-(Ce) from the Tista River, Bangladesh |
| Reference | Torpy et al. 2020 Torpy, A., Wilson, N., MacRae, C., Pownceby, M., Biswas, P., Rahman, M., & Zaman, M. (2020). Deciphering the Complex Mineralogy of River Sand Deposits through Clustering and Quantification of Hyperspectral X-Ray Maps. Microscopy and Microanalysis, 26(4), 768–792 https://doi.org/10.1017/S143192762000135X |
| Date measured | 2018-05-07 |
| Material | Florencite-(Ce) [ CeAl3(PO4)2(OH)6 ] |
| Analysis technique | Cathodoluminescence (CL) |
| Instrument | JEOL 8500F |
| Probe | 20 keV electron beam |
| Beam current | 69.95 nA |
| Probe diameter | 2 μm |
| Acquisition time | 1.39743 s |
| Channel count | 1024 |
| Wavelength range | 348.233 … 730.123 nm |
| Intensity range | -1.72 … 2111 counts |
| Integral | 394476 counts |
| Related measurement | Florencite-(Ce) EDS spectrum, 20 keV e- beam, Torpy et al. 2020 (co-measured) |
| Lines | Sm3+ 2.09357 eV (100%), 2.22077 eV (75.3%), 2.20972 eV (47.7%), 2.1971 eV (18.9%), {{linesearch:78d8af49-efeb-4828-900c-28ee7970001e|Unspecified}}: 2 — 2.4 eV (74.5%) |
Specimen details
Specimen image

Image of a specimen of Zircon from Tista River, Bangladesh
(C) 2020 CSIRO Mineral Resources
Composition
| Element | Atoms | At% | Wt% |
|---|---|---|---|
| Ce | 1 | 3.85 | 27.3 |
| Al | 3 | 11.5 | 15.8 |
| P | 2 | 7.69 | 12.1 |
| O | 14 | 53.8 | 43.7 |
| H | 6 | 23.1 | 1.18 |
| Total | 26 | 100 | 100 |
Measurement image
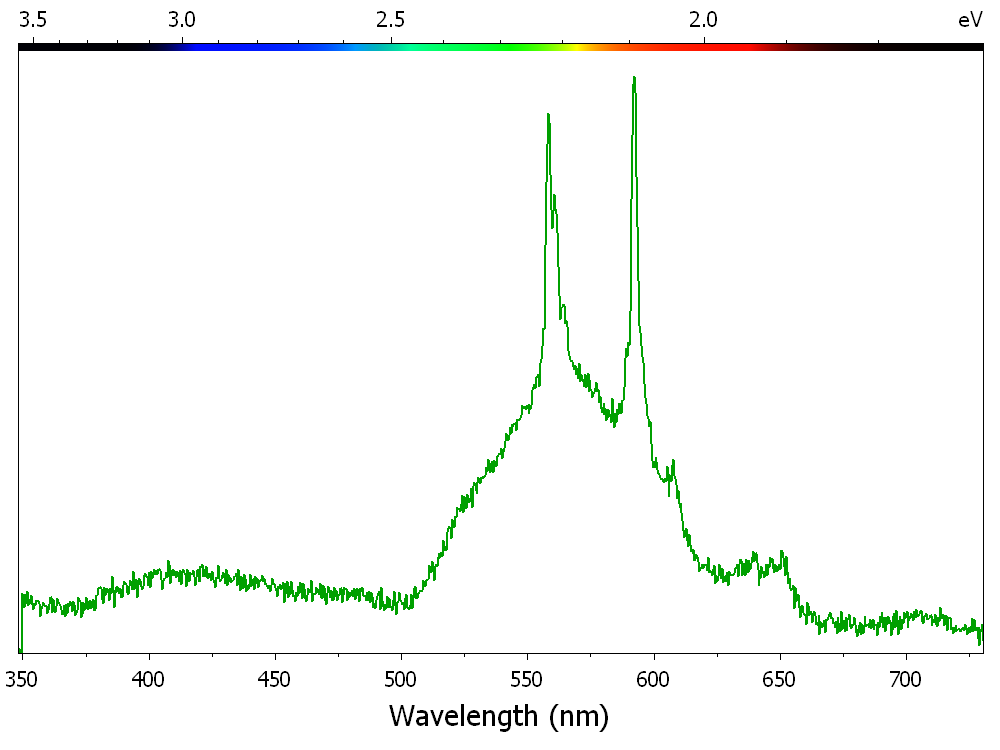
CL spectrum of Florencite-(Ce) from the Tista River, Bangladesh