Amphibole EDS spectrum, 20 keV e- beam, Torpy et al. 2020
Loading...
Measurement details
| Description | EDS spectrum of Amphibole |
| Reference | Torpy et al. 2020 Torpy, A., Wilson, N., MacRae, C., Pownceby, M., Biswas, P., Rahman, M., & Zaman, M. (2020). Deciphering the Complex Mineralogy of River Sand Deposits through Clustering and Quantification of Hyperspectral X-Ray Maps. Microscopy and Microanalysis, 26(4), 768–792 https://doi.org/10.1017/S143192762000135X |
| Date measured | 2018-05-01 |
| Material | Amphibole [ AX2Z5((Si, Al, Ti)8O22)(OH, F, Cl, O)2 ] |
| Analysis technique | Energy dispersive x-ray spectrometry (EDS) |
| Instrument | JEOL 8500F |
| Probe | 20 keV electron beam |
| Beam current | 69.64 nA |
| Probe diameter | 2 μm |
| Detector name | 2× Bruker XFLASH |
| Det. technology | Silicon drift detector (SDD) |
| Real time | 103.6 s |
| Live time | 65.8505 s |
| Dead time | 36.4377 % |
| Channel count | 4096 |
| Energy range | -477.548 … 19984.5 eV |
| Gain | 4.99684 eV/channel |
| Intensity range | 3.158×10⁵ counts |
| Integral | 2.1905×10⁷ counts |
Specimen details
Specimen image
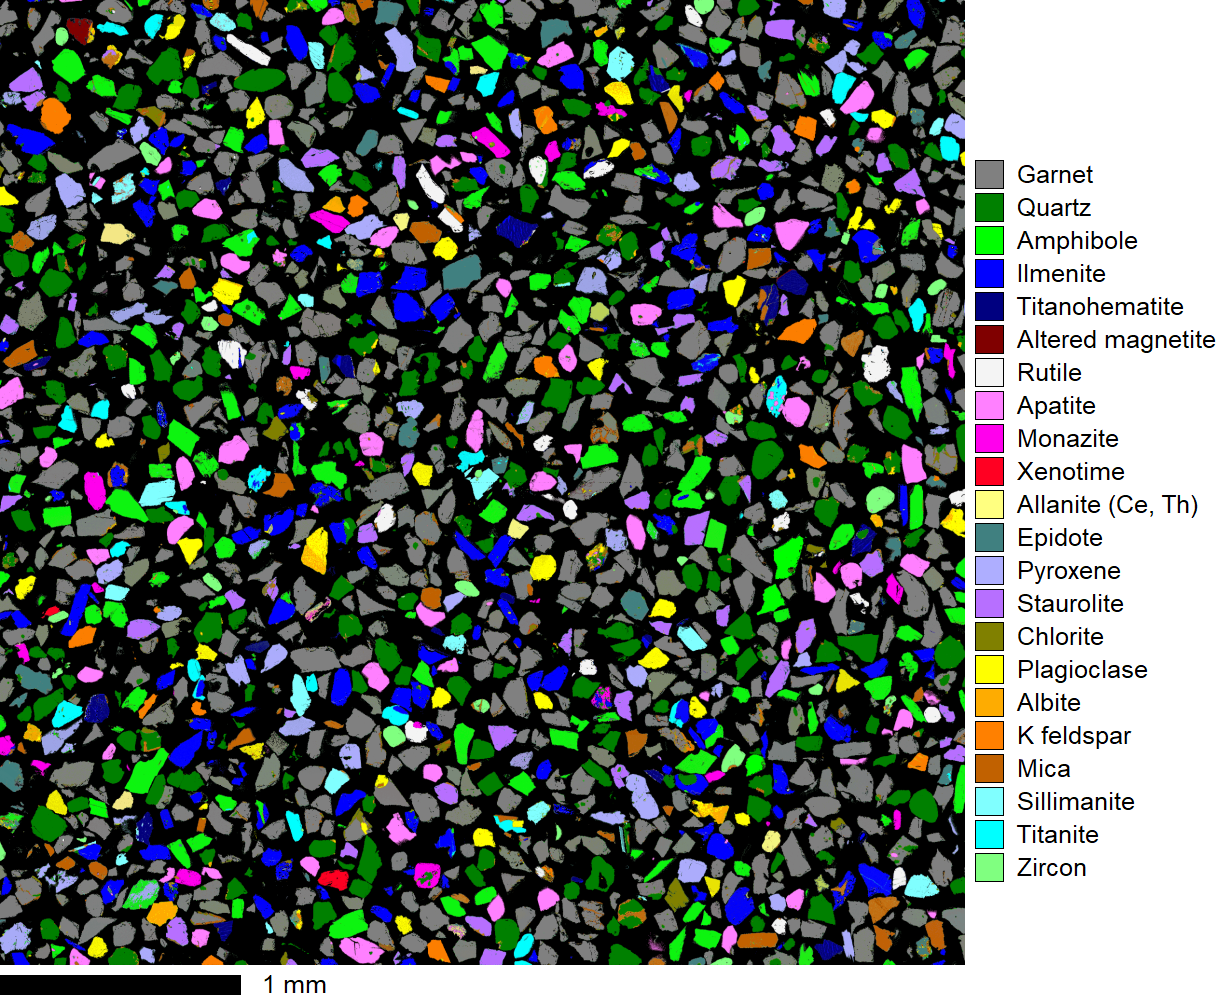
Clustered phase map of river sands (D4 shaker), from the Tista River, Bangladesh. From Torpy et al. 2020
(C) 2020 CSIRO Mineral Resources
Composition
| Element | At% | Wt% |
|---|---|---|
| Na | 1.09 | 1.17 |
| Ca | 0.0433 | 0.081 |
| Mg | 11.5 | 13 |
| Ti | 0.085 | 0.19 |
| Fe | 3.18 | 8.29 |
| Al | 7.37 | 9.28 |
| Si | 16.2 | 21.3 |
| O | 60.5 | 45.2 |
| Total | 100 | 98.51 |