Calcite CL spectrum, 15 keV e- beam, CSIRO 2015
Loading...
Measurement details
| Description | CL spectrum of Calcite from Kharelakh intrusion, Noril'sk, Russia |
| Reference | Spectra from unpublished supplementary material for: Torpy A., Wilson N.C., MacRae C.M., Barnes S., and Verrall M. (2015), Characterising drill core mineralogy by micro-XRD mapping, AMAS XIII: the 13th Biennial Australian Microbeam Analysis Symposium: program and abstracts, Eds: Karsten Goemann, Leonid Danyushevsky and Jay Thompson, University of Tasmania, Hobart, February 2015. IBSN: 978-09580408-5-3. https://nla.gov.au/nla.obj-2477868828/view |
| Date measured | 2015-01-30 |
| Material | Calcite [ CaCO3 ] |
| Analysis technique | Cathodoluminescence (CL) |
| Instrument | JEOL 8500F |
| Probe | 15 keV electron beam |
| Beam current | 40.12 nA |
| Probe diameter | 1 μm |
| Detector name | QE65000 |
| Acquisition time | 35.6813 s |
| Channel count | 1024 |
| Energy range | 1.26074 … 6.23939 eV |
| Intensity range | -444 … 8800 counts |
| Integral | 2.5128×10⁶ counts |
| Comment | CL spectrum from unpublished supplementary material. |
| Measurement tags | Unpublished |
| Related measurement | Calcite EDS spectrum, 15 keV e- beam, CSIRO 2015 (co-measured) |
| Lines | Cr3+ 1.7845 eV (71.4%), {{linesearch:0c9b97a5-52ba-4044-ac0e-57ac4cfa73b8|Mn2+}}: 2.012 eV (100%) |
Specimen details
Specimen image
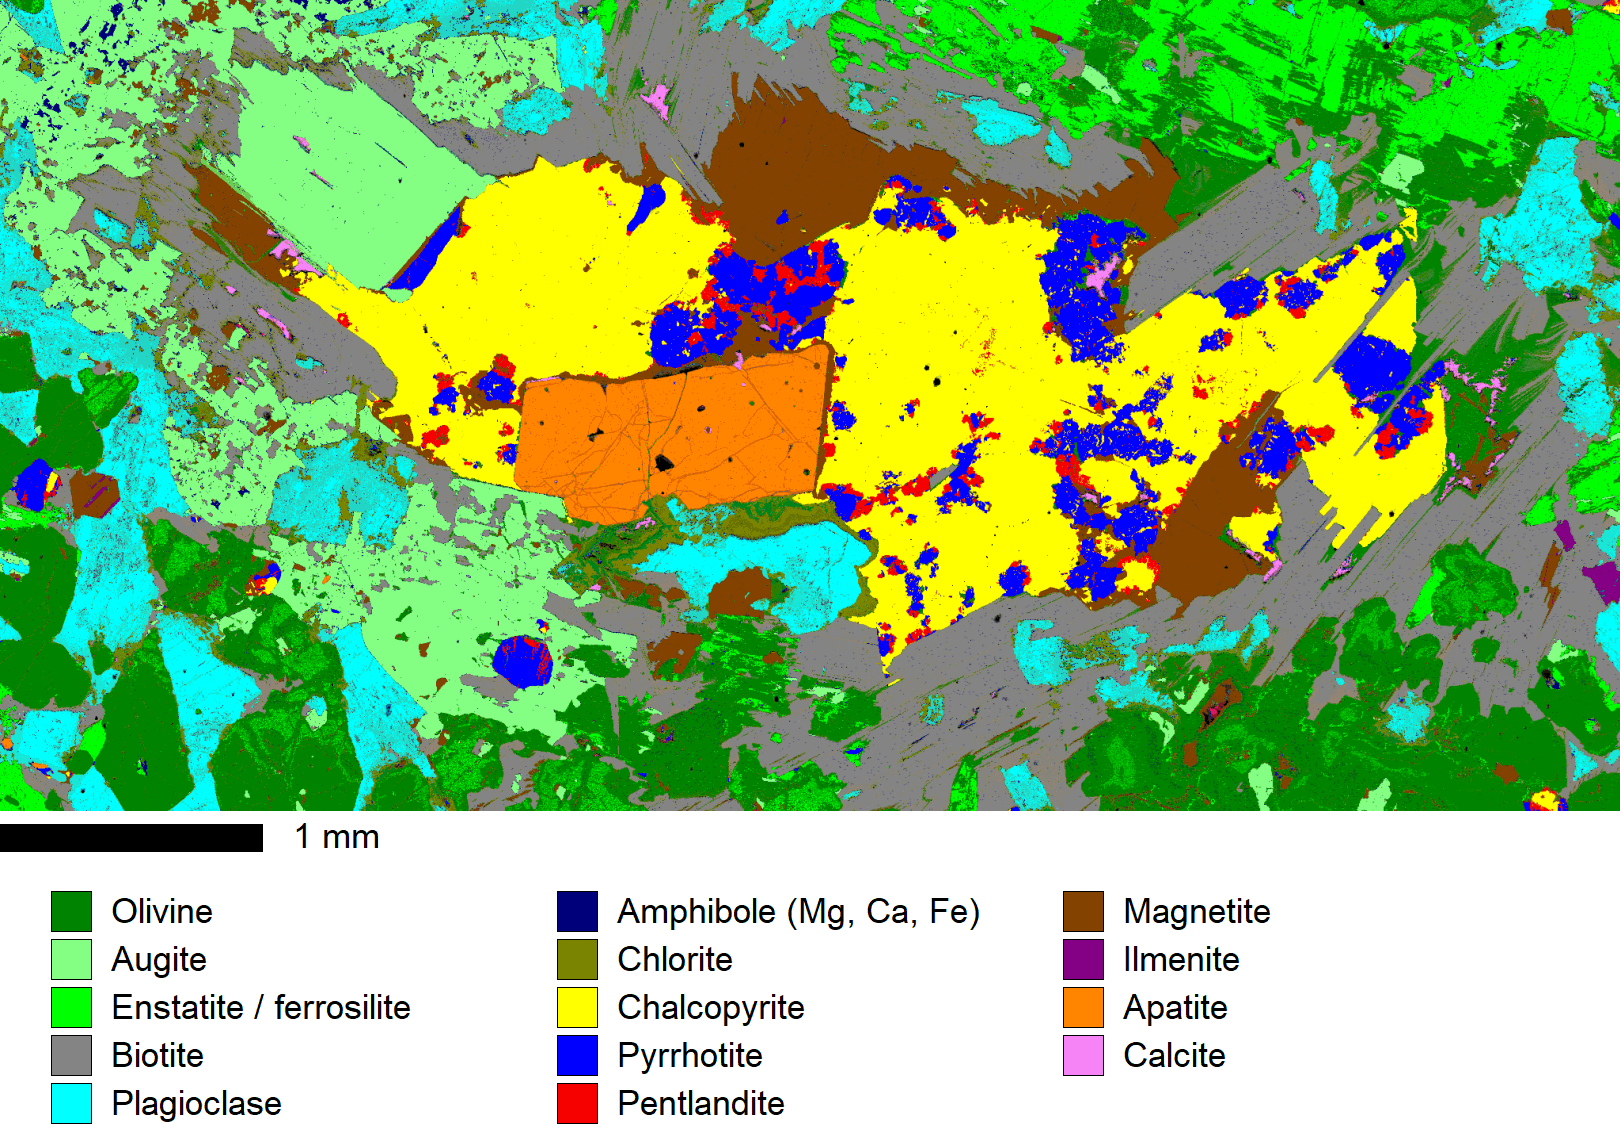
Clustered EPMA phase map of the KH-2 specimen (owner: S. Barnes, CSIRO Mineral Resources), from the Kharelakh intrusion, Noril'sk, Russia
(C) 2015 CSIRO Process Science and Engineering. All Rights reserved.
Composition
| Element | Atoms | At% | Wt% |
|---|---|---|---|
| Ca | 1 | 20 | 40 |
| C | 1 | 20 | 12 |
| O | 3 | 60 | 48 |
| Total | 5 | 100 | 100 |